Showing posts with label higher education. Show all posts

Monday, April 15, 2019

Find Where Students Went To Colleges? IPEDS Migration Enrollment

As a state higher education stakeholder, it will be interesting to know where your college going students went for colleges. Knowing that information can help making policies to either keep students in the state or make the best usage of state resources. The National IPEDS (Integrated Postsecondary Education Data System) survey provided you exactly these information.

For beginner, let's understand how those data were collected. Basically, the IPEDS survey will asked each college/institution to provide information about which State their first-time degree seeking students come from. At the same time, they also asked colleges to separate those students into two groups: One for those graduated from higher school within one year of college attendance and the other for those high school students that waited longer than one year after graduating before enrolled in a college.

By building a data system that hosting these data at the national level, it is possible to see, for a given State, where their college going students went for colleges. Info on a system that provids the data for this article/application and is built to handle IPEDS data at the national level can be found at 'the IT tidbit blog'
with related tutorial/demonstration video posted at: Youtube.com.

This article/application will provide you the knowledge and tools on how to find the migration information at the state level. For detailed information down to the college/institution level, please see the following youtube videos:
College data(Enrollment) States your students come from -IPEDS migration and
IPEDS Nebraska Enrollment Migration College Data
The first video exams which states Nebraska's college students came from and to which institution these students went. The second video shows to which state or institution Nebraska's students went.

For this article, the application is hosted at the Tableau Public and is concerned about state level analysis only. Let's begin with the out-migration first. The out-migration provides reader/user the information about where your college going students went for colleges. Fig. 1 displays exactly that information for students just graduated from high school that attend colleges within 12 months of their graduation.

Figure 1 - Out Migration
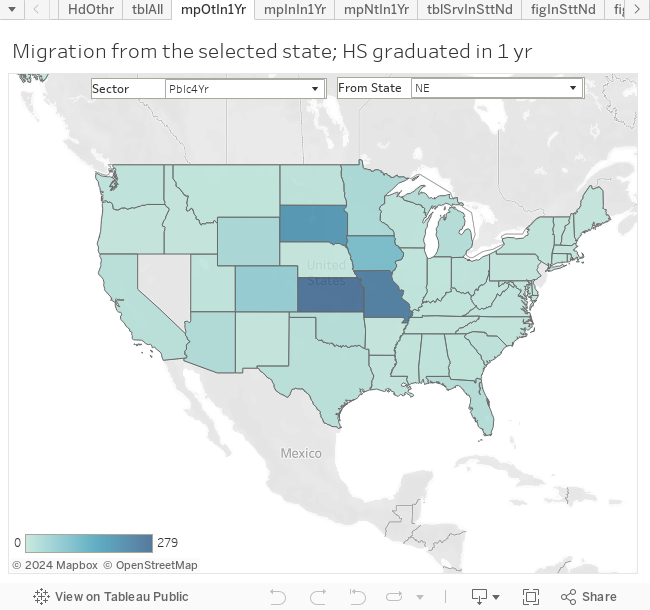
In Fig. 1, if you select public 4 year institution as the sector (Pblc4Yr) and select Nebraska (NE) as the 'From state', you can see Nebraska is sending 279 students to the neighboring state of Kansas (KS).

To get an overall picture, Fig. 2 below provides a way to see the percentage of college goers that are attending the in-state colleges.

Figure 2 - % College Goers Attend In-State Colleges
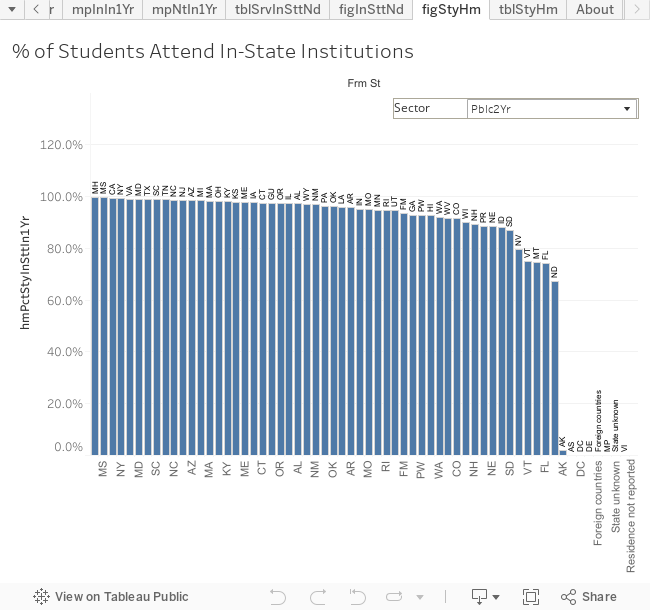
By setting the sector to public-2-year (Pblc2Yr) in Fig. 2, we can observe that for most States, the in-state attendance is around 100% and which is understandable since community colleges were intended to serve local communities. Few exceptions do exist: AK (Alaska), DC (District of Columbia, and DE (Delaware). For Alaska, there is a single public 2 year college: Ilisagvik College. For DC and DE, there is none.

Next, let's exam the number of students that migrated/moved to a particular State. This can be done with the Fig. 3

Figure 3 - In Migration
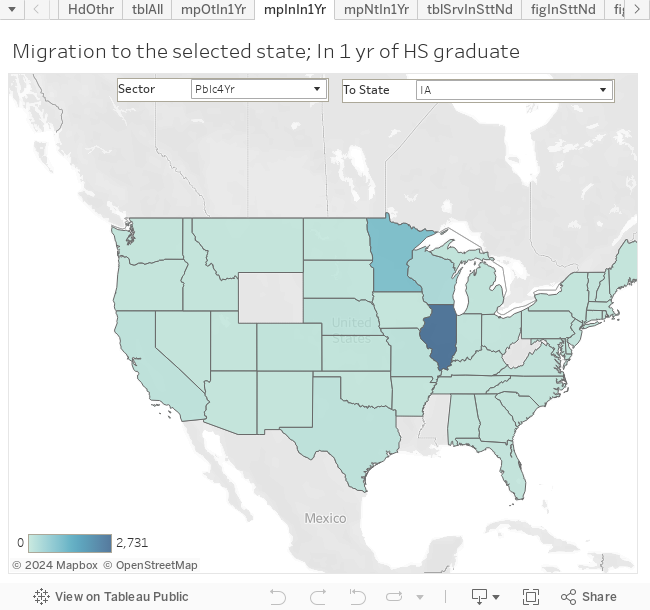
In the case of Fig. 3, if we set the sector to public 4 year(Pblc4Yr) and the 'To state' to IA (Iowa), we notice that there are 2,731 students that left Illinois (IL) and enrolled in Iowa (IA) colleges/institutions.

The next question the readers may have might be... So.. In the Net, if Nebraska lose or gain students from, say, Iowa (IA)? This is exactly what the Fig. 4 can show you.

Figure 4 - Net In-Migration
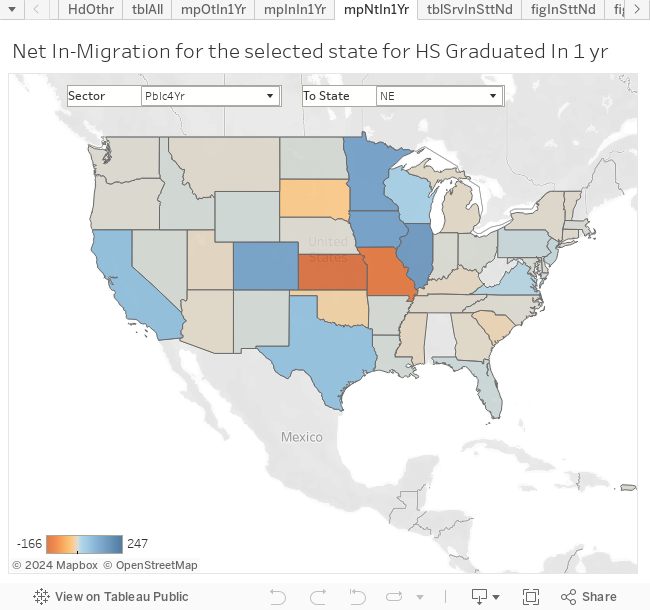
As shown with Fig. 4, Nebraska (NE), in the case of public 4 year (Pblc4Yr), actually gain 137 students from Iowa (IA).

All of the cases about, we are concentrated on students that attend colleges within one year of them graduated from the high schools. Part of the reason is that these are the majority of the students and, also, these are what policy maker may have more influences on.

The next question you might wondering is: if a state do intend to retain all of their college goers, do the state has enough 'space/enrollment-spot' to host all their college goers. There might be other ways to address this question. However, with the data at hand, we intended to answer this question with the Table 1 below.

Table 1 - Serve In-State Needs
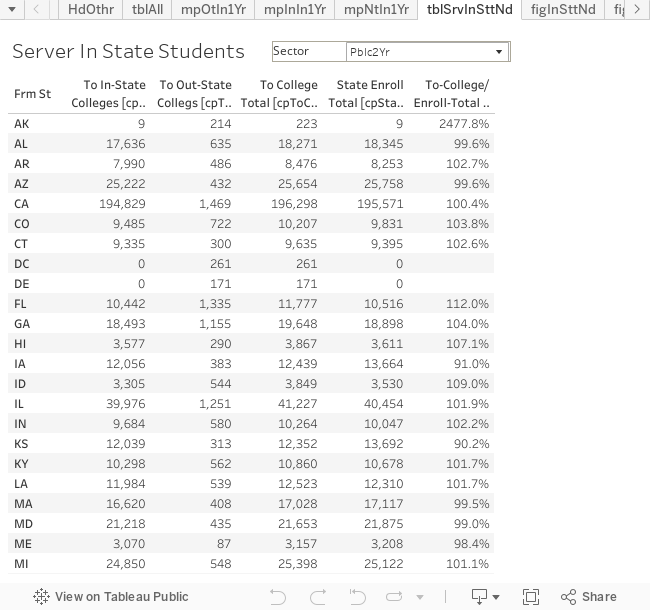
In Table 1, we listed few columns. The second, and the third columns listed college goers that went to in-state, and out-state colleges, while the fourth column provide the total college goers. The fifth column provides the total number of students enrolled in all colleges in the given State, regardless if those students are coming from in-state or out-of-state. We use this column as a measure of the state's enrollment capacity, i.e. the number of students a state's colleges can enroll. By taking the ratio between the college goer and the state capacity, we can see if a state can absorb all its college goers.

By setting the sector in Table 1 to public 4 year (Pblc4Yr), we can observ that Distric of Columbia (DC) simply do not have enough public-4-year institutions to serve its students. State of Illinois is in a similar situation. Fig. 5 below, ranked states based on this ratio from low to high.

Figure 5 - Ranking of Service In-State Needs
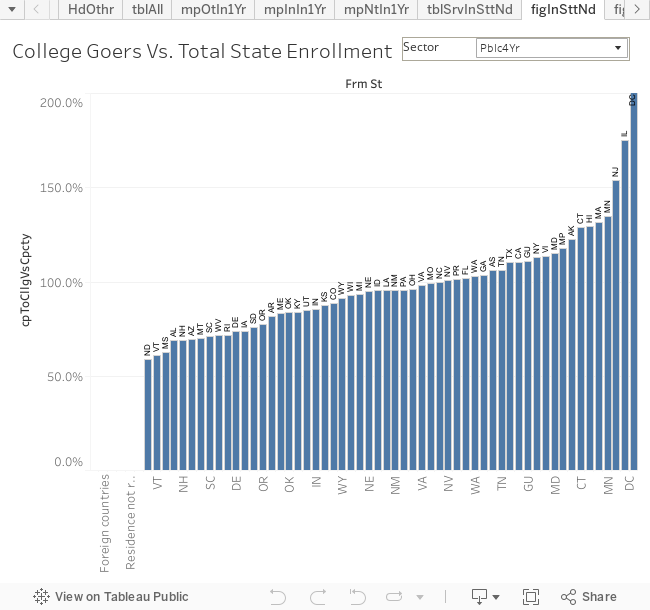
As a side note concerning the Illinois, it was observed in the youtube video: 'College data(Enrollment) States your students come from -IPEDS migration' that Nebraska observed considerable out-of-state students from Illinois. It is now obvious that, not just Nebraska, but there aught be few other States that observe similar phenomena, especially those surrounding Illinois.

Reader should also be cautioned that the In-State-Needs Served ratio should be used carefully. There could have states that most of their students are only interested in 2-year colleges. In that case, there is no need for a lot of 4-year institutions to fulfill the In-State-Needs for 4-year institutions. So, the capacity is relevent to the needs, not the absolute count.

For the convenience of the reader, a table is presented below for the public-4-year sector.

Table 2 - Serving In-State Needs (IPEDS Migration public-4-year institution)
From StateTotal College GoersIn-State CapacityGoers/Capacity
DC1,516467324.6%
IL39,16822,390174.9%
NJ32,66521,232153.8%
MN21,94416,304134.6%
MA20,93615,907131.6%
HI3,9963,093129.2%
CT12,3239,568128.8%
AK3,3882,767122.4%
MD18,40715,971115.3%
NY57,89651,273112.9%
CA144,800131,418110.2%
TX99,92390,772110.1%
TN21,14419,904106.2%
GA51,08349,313103.6%
WA32,17131,221103.0%
FL110,114108,130101.8%
NV13,39913,325100.6%
NC32,76832,87999.7%
MO19,35319,46699.4%
VA31,69832,32298.1%
OH48,48250,60595.8%
NM6,7897,09795.7%
PA43,12945,06195.7%
LA20,70021,65895.6%
ID5,7876,06595.4%
NE8,2138,64795.0%
MI44,12247,30593.3%
WI27,42829,61092.6%
WY1,2981,42391.2%
CO24,44927,62488.5%
KS11,03212,58087.7%
IN29,04433,91985.6%
UT16,05318,89085.0%
KY15,62418,64383.8%
OK14,36917,14883.8%
ME3,6784,40783.5%
AR12,05314,77181.6%
OR8,82011,40877.3%
SD3,9145,15875.9%
DE5,9428,07573.6%
IA9,65413,11373.6%
RI3,1364,38071.6%
WV7,85110,96771.6%
SC13,25318,70070.9%
MT4,4366,35469.8%
AZ16,76324,04969.7%
NH3,5675,15569.2%
AL17,19125,02068.7%
MS7,26811,59462.7%
VT1,9303,16461.0%
ND3,6106,10559.1%
AS415392105.9%
FM1700.0%
GU495446111.0%
MH400.0%
MP360305118.0%
PR12,65112,477101.4%
PW1300.0%
VI384338113.6%
Foreign countries41,06900.0%
State unknown5,23700.0%
Residence not reported3,71700.0%

Monday, June 01, 2015

Evaluate Nebraska's Education-Workforce Pipeline - CIP SOC Crosswalk


The methodology employed by this article is a major improvement over the previous model in that suggested increase or decrease of award production will have no side effects on related fields!
With the P20 initiatives bobbling up all over the United States, the idea of education pipeline has extended from education to the workforce supply. The idea of linking higher education production to economic prosperity has found its way into legislatures.

The idea of aligning higher education production with the workforce demand isn't new. A crosswalk system that linking the field of study to appropriate occupation was last updated in March 2012 by National Center for Education Statistics (NCES) and the Bureau of Labor Statistics (BLS). The crosswalk, also known as CIP to SOC crosswalk, had been used in various workforce supply studies. However, because the complexity of the crosswalk, most of the studies limited their use to few focused fields of interest.

While the CIP to SOC crosswalk is a useful tool, limitations must be observed. The guiding principle behind the development summarized it well:
  • “A CIP-SOC relationship must indicate a “direct” relationship, that is, programs in the CIP category are preparation directly for entry into and performance in jobs in the SOC category. The programs satisfy requirements for entry and/or prepare individuals to meet licensure or certification requirements to work in the occupation.”
An example can provide some clarity to the principle. In the nursing field, the registered nurse program (CIP 513801 Associate degree) is crosswalked to the registered nurse (RN) occupation (SOC 291141 Registered Nurse) and not the Licensed Practical Nurse (LPN) occupation (SOC 292061) even though the registered nurse can certainly worked in the LPN occupation. When interpret the result of this work, please keep this in mind, the result is based on 'appropriate' mapping and not the 'all possible mapping'. In the case of Registered Nurse, State of Nebraska can decide to produce more Registered Nurses to fill the LPN occupation. But that probably isn't the most efficient approach.

This article presents a general approach that is applied to all field of studies. The approach is applied to the state of Nebraska data set but can be easily applied to other states.

The data employed are the 2012-22 long term occupation projection data from Nebraska's Department of Labor and the 2013 degree awarded data from IPEDS' (Integrated Postsecondary Education Data System) completion survey.

While the methodology possessed some very desirable characteristics, like all researches, the data employed played vital role in the outcome. During the development, the job opening advertise data available from Nebraska Department of Labor's website were examined. The data for occupation like 'bus driver, School or Special Client' seems to be OK. The data for hot occupations like nurse or computer related positions post some challenges. For one, there were a lot of entries posted by staffing companies or recruiters and, by reading through some of the entries, some of them are simply phantom entries that mimic the real positions. For the nursing jobs, multi-leveled job listings are common. For example, a position can be advertized as RN/LPN, which begged the question of which category this position is counted under. With these observations, the result presented is based on Labor's projection data which can easily be replaced with more accurate data if such data is available.

The methodology employed by this article is different from that of our previous articles. This new approach eliminated couple of the mentioned limitations of previous methodology. Noticeably, when increase or reduce the number of graduates for a given field following the suggestion of this article would not interfere with the number suggested by this article for other fields. This is a major improvement over the previous model in which additional analysis is needed to make sure no side effect occurred in other related fields.

At the heart of this new methodology is the assumption of equal chance of employment, which means that all graduates that can be walked to an occupation, they all have the same chance of getting hired. If supported by real-life data, this factor can be modified to provide better result.

The top 10 education programs that could be targeted to produce more graduates are:
CIPTitleDgr LevelJob OpenUnFilled
490205Truck and Bus Driver/Commercial Vehicle Operator and Instructor.LessAssct1,024(953)
513999Practical Nursing, Vocational Nursing and Nursing Assistants, Other.LessAssct468(456)
513801Registered Nursing/Registered Nurse.Associate702(292)
520301Accounting.Bachelor467(156)
110101Computer and Information Sciences, General.Bachelor259(113)
520801Finance, General.Bachelor300(55)
460302Electrician.LessAssct154(96)
120401Cosmetology/Cosmetologist, General.LessAssct126(84)
110701Computer Science.Bachelor121(75)
480501Machine Tool Technology/Machinist.LessAssct144(65)
460303Lineworker.LessAssct71(56)


The top 10 eduction programs that could consider reducing graduates are:
CIPTitleDgr LevelJob OpenOver Supplied
540101History, General.Bachelor22163
513801Registered Nursing/Registered Nurse.Master11180
230101English Language and Literature, General.Bachelor27198
510912Physician Assistant.Master43245
450101Social Sciences, General.Bachelor41255
130301Curriculum and Instruction.Master13398
131202Elementary Education and Teaching.Bachelor276404
260101Biology/Biological Sciences, General.Bachelor70436
520201Business Administration and Management, General.Bachelor368588
520101Business/Commerce, General.Bachelor386618


Thursday, February 14, 2013

On Obama’s Bold Plan to Reshape American Higher Education

Original Article

Summary goes here!

A step finally taken, which I have advocated for a long time.

Jest few points about things the author of the article like to see to be included in Obama's plan.

On 'Nobel Prize winner wants to get in the Physics 101 business' should get more weight:
  • Personally, I don't think a Researcher is necessary a better teacher. They may have their own way of understanding things, it does not necessary mean those understanding are on all levels and that they can transfer those idea effectively especially to students that may have totally different mindsets.
  • If there is going to have an objective measurements of outcome, why do we try to add some un-objective impurity to the formula? This is more like going back to the old system where the established (regional accredited) are carrying more weights.
  • By providing this loophole to encourage high level researcher to teach low level courses, aren't we promoting inefficiency? I am not saying there would have no benefits to the students, but I am saying that this by-law is not needed. If they can provide extra benefits to lower level courses, those benefits should be build into the objective measurement formula and, therefore, it will show if the benefits is there and, would, therefore, render the by law unnecessary.

Tuesday, April 03, 2012

Where Did 2009-10 High School Graduates Go to Colleges?

CL Higher Education Center
 

Do you like to know where your high school graduates went to college? What percentage of your high school graduates went to out of state colleges? To what kind of colleges? Private or public? The recent data release from CL Higher Education Center can answer your questions.

IPEDS Higher Ed Residence and Migration - 2010 state level data released

The CL Higher Education Center just put out the early release of the state level summaries for the 2010 NCES IPEDS1 residence and migration survey. Institutions reported the state of residence of their fall-term first time degree seeking students to the Residence and Migration section of the IPEDS fall enrollment survey. The CL Higher Education Center aggregates the institutional level data into the state level summaries. Sector information is maintained through the aggregation process. What this mean is that, for a given state, user can tell how many of their students went to public(or private non-for profit) 4 year institutions outside of their state. Separate files are also published for people interested only in degree-granting institutions.

IPEDS Higher Ed Residence and Migration - 2010 state level data released

1The Integrated Postsecondary Education Data System managed by the National Center for Education Statistics of US Education Department.

Monday, March 28, 2011

How to interpret and select Peer Institution Criteria - An Essay

Other Peer Institution Selection Article

Since we are interested in ranking the performance of the school management, our pick of peer institutions should have similar resources and constrains so that the differences in performance can be attributed to the management of the school.
Peer institution comparison is a common practice for gauging higher institution progresses.

However, the practice of selecting peer institution and how comparison should be examined are not well understood.

This article is trying to shad some light on these two topics.

For selecting peer institutions, the general idea is pick institutions with similar values on some variables/measures. Once these peer institutions are selected, other measures are commonly used to gauge institutions progresses. A logic question that raised from this process is whether a variable should be treated as the picking variable or the comparison variable? If we are interested in gauging progresses caused by an institution's management/administration team, the answer to the question can then be answered logically.

Since we are interested in ranking the performance of the school management, our pick of peer institutions should have similar resources and constrains so that the differences in performance can be attributed to the management of the school. The resources and constrains should referred to things that isn't normally changeable by the will of the school.

To demonstrate the point, let's compare the number of graduates and enrollment a year of an institution. In this comparison, the enrollment could be a better variable than the number of graduates to be used as the picking variable since the enrollment to a large degree are constrained by the size or resource of the school while the number of graduates can be influenced by the deployment of better student support system by the management team. On the other hand, the resources provided by government to public institutions can be a better picking variable than the enrollment since with given resources, institutions can still achieving different level of enrollment success by management team's recruiting efforts.

The topic on how comparison should be examined can also be demonstrated with examples. For example, library expenditure can be used to rank peer institutions. The assumption is that the higher the spending, the better is the school. However, we can argue that in the name of servicing the students and faculties, the library spending is not the meaningful measure since the thing that really matter to students and faculties is the amount of content that is available to students and faculties. An institutions could have lower the library spending by subscribing to online libraries. While the spending is less, the content available to students and faculties are increased.

The other common case is that of the faculty salary. Institutions constantly use the peer institutions to solicit State's support in increasing faculty's salaries. Even though these are legitimate use of peer institutions, there are usually untold stories. Suppose two peer institutions are similar in all measures, the increase of the faculty salaries will inevitably increase the cost of of a degree in that institution. What is mean is that in order to convincingly present its case, institution have to also show their competitiveness in their management too. Likely than not, when presented these kind of agenda, institutions will choose to ignore the other measures, it is, then, the responsibility of the overseeing professional agency, be it the coordination board or legislature, to articulate the case.

Tuesday, January 25, 2011

Are Undergrads Learning Much in College?

Original Article

Graduation rates and assessments are measures that balance each other.
I am in the opinion that the real study begins with students pondering on books.

As to solving today's problem, we need to support professors while, at the same time, evaluate students and publish the results.

I believe most of our professors are well qualified. It is our college kids that need to work hard. For these old kids, it is not the professors' job to tracking them down. Professors are there to provide guidance when these old kids run into obstacles while studying.

Part of the problems these day is that SOME professors are taking the easy way out when facing pressures from student evaluations and administrators and this is why we need to support our professors by evaluating students' learning and publishing the results.

If large percent of graduates failed assessments, it may indicate that professors may have been too easy on their students. This give professors voices to boost their grading system. Publishing the results will help professors to fend off pressures from administrators whose only goal is to boost the graduation rate.

Graduation rates and assessments are measures that balance each other.

Sunday, October 03, 2010

Job outlook for college graduates - the supply and demand in Nebraska

Interact with the author through EduStats - We value your input.
CL Higher Education Center

CL Higher Education Center has just released the data behind the 'workforce supply/demand higher education - Nebraska' report. The methodology is discussed in 'college workforce supply/demand - methodology'.

The released Excel workbook contains few worksheets. One for the oversupply academic programs and one for the under supply academic programs. Besides these two worksheets, there are worksheets that help reader look into how the oversupply and under-supply lists are derived.

In the case of oversupply academic programs, let's look at the academic program: 130301 - Curriculum and Instruction - Master Degree. If we look at the XWalk_ByCIP worksheet, we found that the only appropriate occupation for this CIP is the Instructional Coordinators. That occupation has an annual job opening of 37 while Nebraska colleges produced 523 graduates in the academic year of 2008-09.

An example for the under-supply academic program should provide enough exercises for reader to understand the result better. Look under the XWalk_ByCIP worksheet for the CIP of 521001, it is clear that seven occupations are appropriate for graduates from this CIP. The seven occupations provide a total of 340 job openings a year. By looking under the RvlCIP worksheet for this CIP, we notice that three of the seven occupations can also accept graduates from two other CIPs: 521005 and 521003. These 2 CIPs produce a total 5 graduates in the 2008-09 academic year. The net result is that there can have at least 335 job opening for our focus CIP of 521001. Since during the 2008-09 academic year, there were 226 Nebraska college graduates that are from this CIP, the net results is that there will be at least 109 jobs remain unfilled.

An interesting question to ask is what's the economic implication of all these?

Wednesday, September 29, 2010

workforce supply/demand higher education - Nebraska

Interact with the author through EduStats - We value your input.
Related blogs:
college workforce supply/demand - methodology
Job outlook for college graduates - the supply and demand in Nebraska (Data Release)
Updated on June 8, 2015: An improved methodology applied to 2013 IPEDS college graduates using Nebraska's 2012-2022 long term occupation projection.


For governing, the leader should look past the status quo and project the better future for the community. For education, the survival is a necessary and minimum. Seeking to reaching the learning limits of a human being is the goal.

More than 25 years ago, Ronald Reagan's 'A Nation at Risk' called for education reform. Since then, various projects aimed to improve American's education debuted.

Most recently, Barack Obama called for the increase of postsecondary education population. Due part to the economic downturn, the enrollment in postsecondary education do increase. The questions, however, is what kind of education these students are pursuing? In what field? Will the degrees they are getting fit the needs of the community? And, therefore, be able to find a job opening.

Through the years, researchers and workforce developers have been working hard in trying to answer this question. Education levels needed for jobs have been studied and tabulated. Fields of knowledge needed for particular jobs are also studied. Crosswalks between the academic program and the standard occupation code (SOC) have been built. However, even with all these advances the analysis of the data still post challenges.

As we can all imaging, the crosswalks between academic programs (classified by CIP code) and occupations is not a direct one to one mapping. A single academic programs may provides knowledge for several occupations. On the other hand, a single occupation classification may accepts graduates from various academic programs. And it is exactly this madness that limited the mass analysis of the workforce supply and demand data since manually sorting through each academic program or occupation is most likely needed. For example, a Texas supply and demand study only focused on the big categories. Also, the 'The Occupational Supply Demand System' website only provides tools for navigating between academic programs and occupations.

The data and methodology used to present the finding here represents a first attempt to answer this analysis need. The methodology used can be refined at a much higher processing cost but will be attempted later by the author. For now, our first order approach do provide some useful information for researchers and policy makers. This implies that now the governor, the education authorities and the policy maker can really put their thoughts in DESIGNing the future of Nebraska. Contrasting to the past, the decision of approving new academic program can now based on both the market's supply and demand and the students' interest.

Before presenting the findings, the author like to provide a word of caution. Fulfill the job market is not the ultimate goal for governing or education. For governing, the leader should look past the status quo and project the better future for the community. For education, the survival is a necessary and minimum. Seek to reaching the learning limits of a human being is the goal. The author would also like readers to keep perspectives on earnings and personal interest. None of the data presented is intended to emphasis the higher earning of a job.

The top 10 of our oversupplied academic programs are:
  1. 520201 Business Administration and Management (Bachelor training) - at least 539 graduates would not find a degree appropriate job.
  2. 520101 Business/Commerce, General (Bachelor training) - at least 526 graduates ...
  3. 130301 Curriculum and Instruction (Master training) - at least 486 graduates ...
  4. 260101 Biology/Biological Sciences, General (Bachelor training) - at least 470 ...
  5. 511613 Licensed Practical/Vocational Nurse(LPN, LVN, Cert, Dipl, AAS) (less than 2 year certificates) - at least 228 ...
  6. 131202 Elementary Education and Teaching (Bachelor training) - at least 217 ...
  7. 220101 Law (LL.B., J.D.) (First Professional) - at least 195 ...
  8. 521401 Marketing/Marketing Management, General (Bachelor training) - at least 177 ...
  9. 511201 Medicine (MD) (First Professional) - at least 150 ...
  10. 512001 Pharmacy (PharmD, BS/BPharm [Canada]) (First Professional) - at least 148 ...

The top 10 of our under-supplied academic programs are:
  1. 490205 Truck/Bus/Commercial Vehicle Operation (Less than 2 year certificates) - at least 578 academic-training-appropriate job openings remain to be filled.
  2. 511601 Nursing - Registered Nurse Training (RN, ASN, BSN, MSN) (Associate training) - at least 330 ...
  3. 139999 Education, Other (Bachelor training) - at least 172 ...
  4. 460302 Electrician (Less than 2 year certificates) - at least 133 ...
  5. 521001 Human Resources Management/Personnel Administration, General (Bachelor training) - at least 109 ...
  6. 110301 Data Processing and Data Processing Technology/Technician (Associate training) - at least 105 ...
  7. 310501 Health and Physical Education, General (Less than 2 year certificates) - at least 96 ...
  8. 011102 Agronomy and Crop Science (Bachelor training) - at least 84 ...
  9. 011106 Range Science and Management (Bachelor training) - at least 84 ...
  10. 011105 Plant Protection and Integrated Pest Management (Bachelor training) - at least 84 ...
  11. 011103 Horticultural Science (Bachelor training) - at least 84 ...
A very interesting observation of these two top 10 list is that the Registered Nurse is in shortage supply while the Practical/Vocational Nurse is oversupplied - I think you can imaging how this can happen with the mis-guided marketing campaign. I would like to see how much money have been wasted in producing these over supplied graduates.

*Detailed data table will be published in the up-coming articles. For interacting with the author, please go to here.

For-profit colleges under fire over value, accreditation

Original Article

... we shall all do the the right and justice decision through the course of this revolution.

I think you can find all the related news post and reports.

I believe the title of the article is probably very close to the reality. However, it don't have to be. What I mean is that the for-profit nature of a institution does not have to always produce low value product. It is the regulations that matters. Just think about this, almost of our daily use products are produced by for-profit companies. Even in the world of space industry, NASA isn't over achievement compared with the Scaled.

The current affair is a typical case of finding the weakest to attack. It does not attempt to solve the bigger problem - the accountability. It is reported that while the rule proposed by the Obama administration is intended for the for-profit higher education institutions, non-for-profit institutions voice to against the regulation too - for afraid that the rule may one day applied to the non-for-profit institutions. As far as I am concern, I can't see why not. At least the idea of 'gainful employment' should also applied to public institutions. The low tuition of public institution should not be considered as an exemption since public institution are usually heavily subsidized by tax dollars.

As the article said, it all comes down to the standard. If you have been following education news about accountability, you know the amount resistance from institutions and professors/teachers. I were a teacher before and even though I don't have to like to be evaluated but I am definitely not afraid of being evaluated. Sometimes, I feel that people are over-reacting to the evaluation. In my case, not all my students are the brightest or the hard working type. But to prove that I am not a good teacher, you need more than a test score - for example, they will have to prove that given the same kids, other teacher can do a better job than I can. Yes, I do against firing teachers based sololy on students' test score. But test score itself is not the subject. After all they are objective indicators. The subject is on how to move forward from there. For one, teachers should definitely be given opportunities to present their cases.

For higher education, we all understand that trainings are diverse. However, again, objective measurement is never hurt. Institutions can provide their feedback to the way measurement is done and can ask to clarify what is been measured and can voice their disagreements on their goals of education. The public can look all these information and make decisions and create the market interaction. For example, certain people may considered that the math concept is a definite requirement for a engineer degree and they can choose to attend school with solid math concept program. On the other hand, certain other people may consider, with the computer in mind, that the concept of math isn't as important as it seems, they could be listening to institutions explanation and agreed with them.

With these information in place, people will know exactly what they get and it may happens that it is no longer worth to fabricate a big lie than to actually provide a good services or product.

Personally, I think the for-profit provides a 'private option' to the higher education mix. With its very nature of for-profit, it paid for them to focus everything in efficiency. This could provide a obvious contrast to how public institution is operated. Can these institution success? Given the success of our capitalized private industries, I believe they can given enough flexibility and appropriate regulation - just like all our private companies, we do not specify how much assets they much have, as long as they can produce a good product and did not label anything the product will not do on the product.

Of cause, like we all can image that the success of these institutions could impact our current higher education institutions in big ways. The resistance and hostility from other sectors of the higher education is also expected. But we shall all do the the right and justice decisions through the course of this revolution.

Tuesday, March 16, 2010

College Going Rates by State - an Analysis

Interact with the author through EduStats - We value your input.

See Data Release:
College Going Rates by State - 2008 Early Release
College going rates by state 2008 analysis
Estimated US College Going Rates by State - 2005-06

The college going rate ( aka the college continuation rate) data for normal 2005-06 high school graduates went to degree-granting higher education institutions has been tabulated by both Tom Mortenson and Duncan Hsu. The later also includes information on un-normal high school graduates and the non-degree granting higher education institutions. All these tabulations are based on National Center for Education Statistics' (NCES') Common Core Data (CCD), Private School Survey (PSS) and the Integrated Postsecondary Education Data System (IPEDS).

Available reports so far were more interested in the overall degree-granting college going rates by state without looking into other details. Our analysis is aimed to provide a more complete picture.

Let's started with the US averages for college going rate. The average showed that, for normal high school graduates, 61.3% of them went to degree-granting colleges while 1.5% went to non-degree granting colleges. The list of rates are given below.

State % Dgree-Granting % Not-Dgree-Granting % All College Going
Alabama 62.7% 0.3% 63.0%
Alaska 45.7% 2.1% 47.8%
Arizona 44.8% 1.9% 46.7%
Arkansas 56.6% 0.9% 57.5%
California 55.8% 1.2% 57.1%
Colorado 63.0% 1.6% 64.6%
Connecticut 70.4% 2.7% 73.1%
Delaware 64.2% 1.4% 65.6%
District of Columbia 56.9% 8.6% 65.5%
Florida 60.2% 2.8% 63.0%
Georgia 68.2% 1.7% 69.9%
Hawaii 59.7% 0.5% 60.2%
Idaho 45.7% 0.9% 46.6%
Illinois 60.8% 1.2% 61.9%
Indiana 63.5% 0.9% 64.4%
Iowa 61.6% 1.1% 62.7%
Kansas 65.7% 1.7% 67.4%
Kentucky 61.4% 0.8% 62.3%
Louisiana 65.7% 1.4% 67.0%
Maine 64.7% 0.8% 65.5%
Maryland 65.7% 2.1% 67.8%
Massachusetts 71.8% 2.1% 73.8%
Michigan 65.3% 1.3% 66.5%
Minnesota 68.4% 1.4% 69.7%
Mississippi 75.7% 0.7% 76.3%
Missouri 57.1% 0.8% 57.9%
Montana 58.1% 0.9% 59.0%
Nebraska 64.5% 1.0% 65.5%
Nevada 52.1% 1.7% 53.8%
New Hampshire 65.0% 1.1% 66.2%
New Jersey 69.7% 2.1% 71.8%
New Mexico 70.5% 1.0% 71.5%
New York 74.4% 1.6% 76.1%
North Carolina 65.6% 0.6% 66.2%
North Dakota 72.3% 1.0% 73.3%
Ohio 60.1% 1.0% 61.1%
Oklahoma 59.2% 4.4% 63.5%
Oregon 47.3% 1.0% 48.4%
Pennsylvania 62.1% 1.5% 63.7%
Rhode Island 54.7% 2.2% 56.9%
South Carolina 71.1% 0.7% 71.7%
South Dakota 71.9% 0.8% 72.7%
Tennessee 63.5% 2.7% 66.3%
Texas 55.2% 2.2% 57.4%
Utah 46.2% 1.1% 47.3%
Vermont 55.4% 0.8% 56.2%
Virginia 67.3% 1.0% 68.2%
Washington 48.0% 0.9% 49.0%
West Virginia 57.8% 2.8% 60.6%
Wisconsin 61.2% 0.7% 62.0%
Wyoming 58.1% 0.6% 58.6%


US Total 61.7% 1.5% 63.2%

Analyzing the non-degree granting college going rates reveals that most of the states have a rate of lower than 3% while the Oklahoma posted a rate of 4.4% and District of Columbia boasted a rate of 8.6%.

N_Degree-Granting

The frequency distribution of the degree-granting college going rates shows that while most of the states have a rate of greater than 54%, there are seven states that are away from the pack. These states are: Nevada(52.1%), South Carolina(49.0%), Washington(48.0%), Oregon(47.3%), Utah(46.2%), Alaska(45.7%), Idaho(45.7%) and Arizona(44.8%).

Degree-Granting

Diving into the degree-granting college going rate, we found that, in general, the four year college going rate is higher that of the two year college going rate. For the nation, the traditional four year colleges enrolled about 68% of all the degree-granting colleges going students, where the traditional four year colleges are defined as the public four year colleges plus the private non-for profit four year colleges. The overall degree-granting college going rate, separated into type of colleges and ranked by state is presented here.

Degree-Granting college going rates by state

As we can see from the chart the fractions taken by the traditional four year colleges varies from state to state. Analyzing the fraction, it reveals that the range varies from 35% (Mississippi) to about 95% (Alaska) and, except for on state (Mississippi, 35%), all states have fractions higher than 52%. While Alaska sending almost all of its students to traditional four year colleges, Mississippi sending only 35%. Looking for the Mississippi in the above chart, we notice that Mississippi achieving the highest degree-granting college going rate by sending most of its college going students to colleges other than the traditional four year colleges - noticeably, the two year public schools. District of Columbia(91%) and Vermont (90%) also send high percentage of their college going students to traditional four year schools.

distribution of the Percentage of traditional four year college

The following chart ranked states by the traditional four year college going rate.

traditional four year college going rate

Rounding up the four year schools, we considered the private for-profit four year schools. On average, the college going rate for this sector is about 1%. Checking out the frequency distribution for this sector, it shows that for most of the states, this rate is lower than 1.6% while there are four states that with higher rates: Florida (2.7%), New Mexico (2.5%), New Hampshire (2.2%) and Arizona(1.9%).

Private four-year for-profit College Going Rates

For two years-or-less schools, the biggest sector is the public two year schools with an average of 17.7% college going rate. Analyzing the sector, it shows all states except three are confined within 2 to 24%. At the higher ends are Mississippi (48%), Wyoming (27.1%) and New Mexico (27%).

Public two-year College Going Rates

For private two years-or-less schools, the for-profit schools averaged at 0.8% while the not-for-profit schools averaged at 0.2%. The for-profit sector reveals that all states except three are falling within the range of 0.2 to 1.4%. The three at the higher end are Pennsylvania (2.8%), Colorado (2.5%) and Ohio (1.7%). In the not-for-profit sector, majority (25) of the states have a rate of 0.1% with all of them below 1%. The highest two states are Hawaii and South Carolina at a rate of 0.8%.

Private for-profit two-year College Going Rates

Private not-for-profit two-year College Going Rates

Rounding up the article, we like to note that there are much more to the college going rates than the overall degree-granting college going rate. Examining together with other factors like in-state, out-state college going rate, the college graduation rates and the industry hiring pattens can reveal even more information.

Tuesday, January 12, 2010

IPEDS Higher Ed Residence and Migration - 2008 state level Imputed released

CL Higher Education Center

Do you like to know where your high school graduates went to college? What percentage of your high school graduates went to out of state colleges? To what kind of colleges? Private or public? The recent data release from CL Higher Education Center can answer your questions.

The CL Higher Education Center just put forward the state level summaries for the 2008 NCES IPEDS1 residence and migration survey. This release uses the imputed data which, in theory, provide a better estimate to the real picture.

The report shows that Texas Higher Education as a whole enrolled the highest per cent (94.0) of their own recent high school graduates followed by California (92.5), New Jersey (91.3) and Michigan (90.7). For public 4 year schools, again, the Texas enrolled the highest per cent(95.7) of their own recent high school gradates who went to public 4 year school followed by California (95.3) and New Jersey (93.4).

The analysis also shows that 71.0% of recent high school graduates of District of Columbia who went to 4 year public schools went to out-of-state institutions followed by Minnesota (40.6) and New Jersey (38.7).

The data show that, on average, 16% of high school graduates who went to public 4 year institutions went to out of state institutions. On the other hand, only 3 percent of high school students who went to 2 year public institutions went to out of state institutions. Looking at private 4 year non-for profit institutions, it shows that 47% of high school graduates who attended private 4 year non-for profit institutions went to out of state institutions.

1The Integrated Postsecondary Education Data System is managed by the National Center for Education Statistics of US Education Department.

Tuesday, August 04, 2009

IPEDS Higher Ed Residence and Migration - 2008 state level data released

CL Higher Education Center

Do you like to know where your high school graduates went to college? What percentage of your high school graduates went to out of state colleges? To what kind of colleges? Private or public? The recent data release from CL Higher Education Center can answer your questions.
The CL Higher Education Center just put out the early release of the state level summaries for the 2008 NCES IPEDS1 residence and migration survey. Institutions reported the state of residence of their fall-term first time degree seeking students to the Residence and Migration section of the IPEDS fall enrollment survey. The CL Higher Education Center release aggregates the institutional level data into the state level summaries. Sector information is maintained through the aggregation process. What this mean is that, for a given state, user can tell how many of their students went to public(or private non-for profit) 4 year institutions outside of their state. Separate files are also published for people interested only in degree-granting institutions.

The data show that, on average, 16% of high school graduates who went to public 4 year institutions went to out of state institutions. On the other hand, only 3 percent of high school students who went to 2 year public institutions went to out of state institutions. Looking at private 4 year non-for profit institutions, it shows that 47% of high school graduates who attended private 4 year non-for profit institutions went to out of state institutions.

1The Integrated Postsecondary Education Data System managed by the National Center for Education Statistics of US Education Department.

Tuesday, July 21, 2009

IPEDS Higher Ed Migration - 2006 state level released

Release note at CL Higher Education Center

Do you like to know where your high school graduates went to college? What percentage of your high school graduates went to out of state colleges? To what kind of colleges? Private or public? The recent data release from CL Higher Education Center can answer your questions.

The CL Higher Education Center just released the state level data for 2006 NCES IPEDS1 migration data. The release aggregates the institutional level data collected by the IPEDS survey into the state level data. Sector information is maintained through the aggregation process. What this mean is that, for a given state, user can tell how many of their students went to public(or private non-for profit) 4 year institutions outside of their state. Separate files are also published for people interested only in degree-granting institutions.

The data show that, on average, 16% of high school graduates who went to public 4 year institutions went to out of state institutions. On the other hand, only 3 percent of high school students who went to 2 year public institutions went to out of state institutions. Looking at private 4 year non-for profit institutions, it shows that 47% of high school graduates who attended private 4 year non-for profit institutions went to out of state institutions.

1 The Integrated Postsecondary Education Data System managed by the National Center for Education Statistics of US Education Department.

Tuesday, January 22, 2008

Staff Salary By Race - University of Nebraksa

Original Article

Disparities are very likely to appear at low-skill jobs where abilities can easily be overridden by personal preferences. In the study, we see that for low-end jobs, where the salary scale begins at bellow 20 thousands a year, there are higher percentages of Whites in the high salary scale. Disparities exist in all minorities. In the Service/Maintenance category, Asian receives the worst salary offering with 85% of them receive the lowest salaries comparing to 53% for Black, 44% for Native American, 46% for Hispanics and 36% for Whites.

Literature Overview

For years, salary differences in the higher education had been a much-studied topic. Most of the studies focused on faculty and gender disparities. These studies provided useful information in recognizing possible gender discrimination inside higher education communities. However, almost all of these studies are focused on faculties and did not examine the possible disparities among staffs. In addition to that, most of the studies are interested in gender disparity rather than race disparities.

Fresh ideas in this analysis

Instead of studying disparities in faculty and gender, this analysis focused on staff and race. Implications of this study are many. For one, we hope this report will encourage a broader discussion on staff disparity since the working staff is a better representation of the working class of American than faculty. Second to that, we hope this study will illustrate that disparities do not appear only in the high paying jobs.

One of the suspicions we had in conducting this analysis was that disparities are very likely to appear at low-skill jobs where abilities can easily be overridden by personal preferences.

Limitation of data and this report

The source data used in this report is the 2005 Staff survey collected via the Integrated Postsecondary Education Data System by US Department of Education. The data is available for download from their Peer Analysis Site.

This report is a preliminary analysis. Our focus is on the University of Nebraska campuses. Since there weren't many minorities working in the University of Nebraska when broken down by job categories, some of the analysis in this report may not be statistically sound. We, however, view this as a pilot study that could inspire researchers to work on this kind of data.

Among job categories, the administrator and skilled crafts contain too few minorities to be considered statistically sound.

We also like to point out that we have no intention in singling out the University of Nebraska. We believe the problem could well exist in all parts of our society.

Notes in handling of data

Since Hispanic is considered an ethnicity and can, therefore, have the appearance of any race, this report aggregates minorities in two ways in hope to identify if discrimination is an act based on the perceived appearance of minorities. One aggregation is labeled Minority_1 and does not include Hispanics. The other one, labeled Minority_2, does include Hispanics.

High lights in the analysis

In general, we see that for low-end jobs, where the salary scale begins at bellow 20 thousands a year, there are higher percentages of Whites in the high salary scale. For high paying jobs, except at the very top salary scale, there are usually higher percentages of Whites at higher salary scales. In the Service/Maintenance category, Asian receives the worst salary offering with 85% of them receive the lowest salaries comparing to 53% for Black, 44% for Native American, 46% for Hispanics and 36% for Whites.

Charts


Clerical
Administrator
OtherProfessional
ServiceMaintenance
SkilledCrafts
Paraprofessional
SrvcMntnnc3D

Thursday, December 06, 2007

Postsecondary Education and Nebraska's Future forum

Original Article
Related material on the internet:
Nebraska Innovation Forum
University of Nebraska 2000 - 2004(strategy plan?)

This is a news report not my comments on the event.

On Dec. 5, 2007, Nebraska Coordinating Commission for Postsecondary Education (CCPE) and Senator Ron Raikes, Chair, Nebraska Legislature's Education Committee, co-host the forum: Postsecondary Education and Nebraska's Future.

The forum features presentations by Dennis Jones, president, National Center for Higher Education Management Systems and Q&A sessions with Nebraska leaders - Dennis Baack, Stan Carpenter, Doug Christensen, Tip O'Neil, Linda Ray Pratt (above, represent education sector), Wendy Boyer and Jim Linderholm (business sector). Nebraska Governor Dave Heineman is also invited. Dennis Jones' presentation can be found here.

Dennis Jones, a native Nebraskan who had been invited to give similar talks to Nebraska's policy makers in the past(e.g. 2003), made his points even clear this time that the most important thing for Nebraska is to strive on economic development. In general, his talk concluded that Nebraska is doing a fair job in educating our kids but is short on building a sustainable economics and, as a result, Nebraska was not able to retain these well educated kids and was not able to achieve economic gain.

At the Q&A session, several good points are raised. Stan Carpenter, with daughter in school, talk about customizing system to fit students learning style. Doug Christensen talked about what K12 system have done in recruiting minority students. Dennis Baack talked about community colleges' efforts in working with Universities, State colleges and private institutions in making the system more economic. Tip O'Neill talk about the culture changes in savings and about legislature's efforts in encouraging saving for education. Linda Ray Pratt talked about University's willingness in engaging the society in economic development and University's efforts in creating the innovation park. She also talked about UNO's efforts in attracting Iowa students. Wendy Boyer, when asked about businesses' view about the training need from higher education institutions, talked about the mixed need from business world and talked about the short term specific training needs of businesses.

Governor Dave Heineman use his opportunity to talk about the difficult budget decision he have to make between other issues and education. Even though he has passions on education and economic development, the tight state budget is limiting the funding state can appropriate to education. The lower tax and budget discipline is his signature.