If you are looking for online program offered by United States' public colleges, please use this online search tool/application to find colleges offering them.
With higher education continuing to be considered the footstep to reaching personal economic sufficiency, the demand for postsecondary education continues to grow. With the growing demands, governments, states, private companies, and institutions were working hard to capitalize and meet the demands. Distance education, with its nature, overcome several traditional higher education limitations.Basic statistics of the distance education in United States were published in the 'Digest of Education Statistics' by National Center for Education Statistics (NCES). The most recent summary table published can be found here.
The table presents national level data with sector break down using the preliminary 2016 IPEDS (Integrated Postsecondary Education Data System) data published back in Feb. 2018. The table shows two years (2015 and 2016) of data, which are of limited use in showing the trends.
The purpose of this article is to fill the gaps and present some trend data using the 'data master' data system developed by the author. Information about the data system can be found at the ITTidbit, the Youtube, and the Vimeo.
For this article, I will be dealing with the National level data only as opposed to State level data, which will be dealt with in separate articles. The data presented here would be an enhancement to the basic statistics published by NCES in terms of the years of coverage, the break down of categories, and the revision of the data. The data used are revisions published by IPEDS as of Oct. 24, 2018.
The general observations of the data are:
- For degree-seeking students (include graduate students), which is the majority of undergraduates, the fraction of students taking online classes continue to grow.
- For 4-year schools, public and private not-for-profit schools, the number of students taking online classes are continue to grow.
- For 4-year degree seeking, private for-profit schools show high degree use of distance education - 65-80% vs. 15-30% for public and private not-for profit schools.
DC+50States of US; 4-year Inst.; Undergraduate Total; Any Online Course;
Head Count : (4-year; Under)

Percent of Undergraduate Enrollment : (4-year; Under)
DC+50States of US; 4-year Inst.; Undergraduate Degree Seeking; Any Online Course;
Head Count : (4-year; Under; Degree Seeking)

Percent of Undergraduate Degree Seeking Student : (4-year)

DC+50States of US; 4-year Inst.; Undergraduate non-Degree Seeking; Any Online Course;
Head Count : (4-year; Under; non-degree seeking)

Percent of Undergraduate non-Degree Seeking students: (4-year)
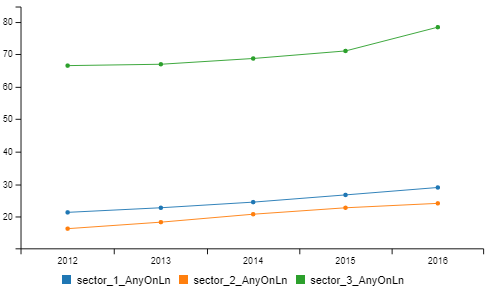
DC+50States of US; 4-year Inst.; Graduate; Any Online Course;
Head Count : (4-year; Graduate students)
The chart above presents the enrollment headcount for graduate students that taking any online course in 4-year institutions located in the DC or the 50 states of United States. The blue line represents the public 4-year institutions while the orange line represents the private not-for-profit 4-year institutions. The green line represents the private for profit 4-year institutions.
Percent of Graduate enrollment : (4-year)

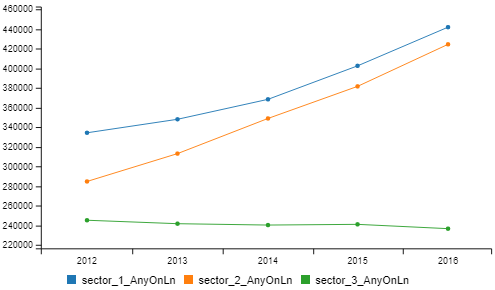
DC+50States of US; 2-year Inst.; enroll total; Any Online Course;
Head Count : (2-year; enroll total)

The chart above presents the enrollment headcount for undergraduate students that taking any online course in 2-year institutions located in the DC or the 50 states of United States. The blue line represents the public 2-year institutions while the orange line represents the private not-for-profit 2-year institutions. The green line represents the private for profit 2-year institutions. One thing stand out in this chart is that the public 2-year institutions have much more students than that of private 2-year institutions.
Percent of enrollment total : (2-year)

DC+50States of US; 2-year Inst.; degree seeking; Any Online Course;
Head Count : (2-year; degree seeking)

Percent of degree seeking students : (2-year)

DC+50States of US; 2-year Inst.; non-degree seeking; Any Online Course;
Head Count : (2-year; non-degree seeking)

Percent of non-degree seeking students : (2-year)

=============
Data published by NCES Digest of Education Statistics:
- Compare with private, public institution show less (%) distance students. Also less (%) exclusive distance students.
- Compare with graduate, undergraduate show less (%) exclusive students but more none-exclusive students.
- For profits shows much more exclusive students (4-year) - I assuming 2-year of smaller scale and not enthusiasm about distance ed.
- 2 year, in general, more exclusive.
- public has more in-state than out-of-state; private, the reverse is true.
For public institution, because of the mission of educate state residents, public institution, in general, enrolls state residence and, therefore, less students from out of state and less students taking distance education courses from out of state.
It, however, can be a strategy move for public institution to accept out of state students if the capacity is allowed and to recover the cost of development.
It is also interested to see if it is possible to relate fields distribution to the number of students taking online courses since, likely, some fields are more suitable for online presentation.
From policy point of view, it may not be easy to make arguments with simple head count distribution since there are many factors in deciding what is an appropriate % of online courses.
Distance education, by definition, allow students to take courses away from the campus and, in that way, reduces spaces requirement. On the other hand, the requirement for staff's time may not reduced - staff will be transferred to work on tutorial duties. In a sense, you increase the quality in liue of reduce cost.
Serve the public - student body - the whole state.
How privates contributes.
Institution size - related to distance ed. - Serve each other institution.
here


