Showing posts with label IPEDS. Show all posts

Monday, April 15, 2019

Find Where Students Went To Colleges? IPEDS Migration Enrollment

As a state higher education stakeholder, it will be interesting to know where your college going students went for colleges. Knowing that information can help making policies to either keep students in the state or make the best usage of state resources. The National IPEDS (Integrated Postsecondary Education Data System) survey provided you exactly these information.

For beginner, let's understand how those data were collected. Basically, the IPEDS survey will asked each college/institution to provide information about which State their first-time degree seeking students come from. At the same time, they also asked colleges to separate those students into two groups: One for those graduated from higher school within one year of college attendance and the other for those high school students that waited longer than one year after graduating before enrolled in a college.

By building a data system that hosting these data at the national level, it is possible to see, for a given State, where their college going students went for colleges. Info on a system that provids the data for this article/application and is built to handle IPEDS data at the national level can be found at 'the IT tidbit blog'
with related tutorial/demonstration video posted at: Youtube.com.

This article/application will provide you the knowledge and tools on how to find the migration information at the state level. For detailed information down to the college/institution level, please see the following youtube videos:
College data(Enrollment) States your students come from -IPEDS migration and
IPEDS Nebraska Enrollment Migration College Data
The first video exams which states Nebraska's college students came from and to which institution these students went. The second video shows to which state or institution Nebraska's students went.

For this article, the application is hosted at the Tableau Public and is concerned about state level analysis only. Let's begin with the out-migration first. The out-migration provides reader/user the information about where your college going students went for colleges. Fig. 1 displays exactly that information for students just graduated from high school that attend colleges within 12 months of their graduation.

Figure 1 - Out Migration
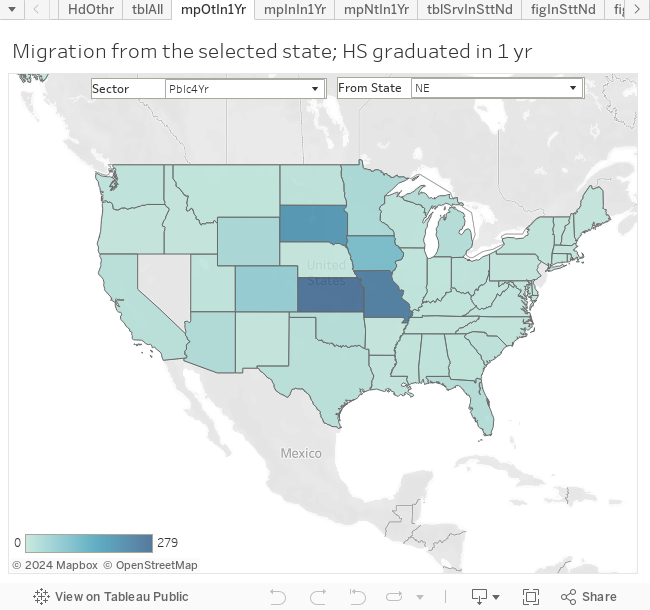
In Fig. 1, if you select public 4 year institution as the sector (Pblc4Yr) and select Nebraska (NE) as the 'From state', you can see Nebraska is sending 279 students to the neighboring state of Kansas (KS).

To get an overall picture, Fig. 2 below provides a way to see the percentage of college goers that are attending the in-state colleges.

Figure 2 - % College Goers Attend In-State Colleges
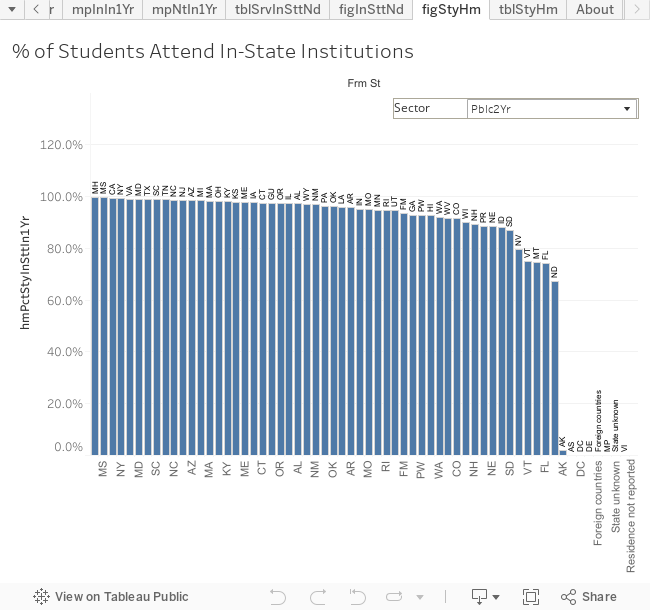
By setting the sector to public-2-year (Pblc2Yr) in Fig. 2, we can observe that for most States, the in-state attendance is around 100% and which is understandable since community colleges were intended to serve local communities. Few exceptions do exist: AK (Alaska), DC (District of Columbia, and DE (Delaware). For Alaska, there is a single public 2 year college: Ilisagvik College. For DC and DE, there is none.

Next, let's exam the number of students that migrated/moved to a particular State. This can be done with the Fig. 3

Figure 3 - In Migration
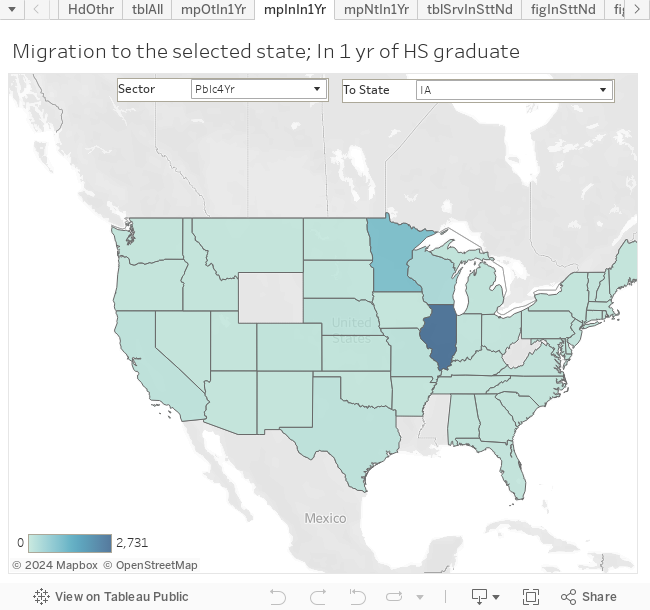
In the case of Fig. 3, if we set the sector to public 4 year(Pblc4Yr) and the 'To state' to IA (Iowa), we notice that there are 2,731 students that left Illinois (IL) and enrolled in Iowa (IA) colleges/institutions.

The next question the readers may have might be... So.. In the Net, if Nebraska lose or gain students from, say, Iowa (IA)? This is exactly what the Fig. 4 can show you.

Figure 4 - Net In-Migration
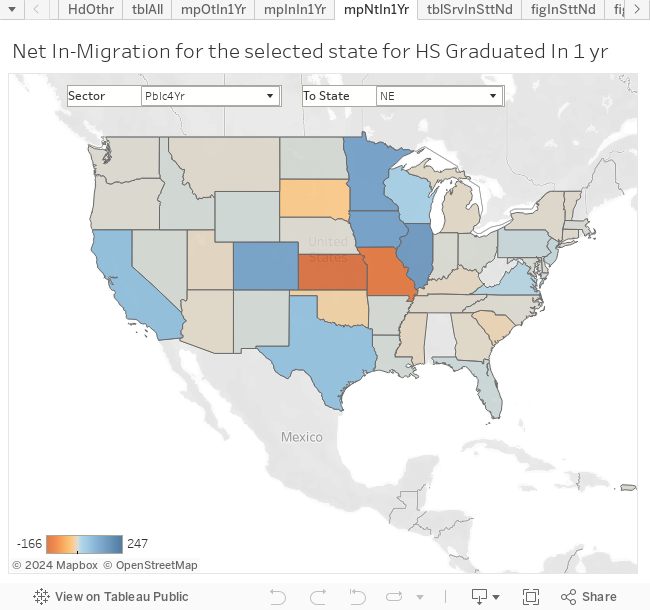
As shown with Fig. 4, Nebraska (NE), in the case of public 4 year (Pblc4Yr), actually gain 137 students from Iowa (IA).

All of the cases about, we are concentrated on students that attend colleges within one year of them graduated from the high schools. Part of the reason is that these are the majority of the students and, also, these are what policy maker may have more influences on.

The next question you might wondering is: if a state do intend to retain all of their college goers, do the state has enough 'space/enrollment-spot' to host all their college goers. There might be other ways to address this question. However, with the data at hand, we intended to answer this question with the Table 1 below.

Table 1 - Serve In-State Needs
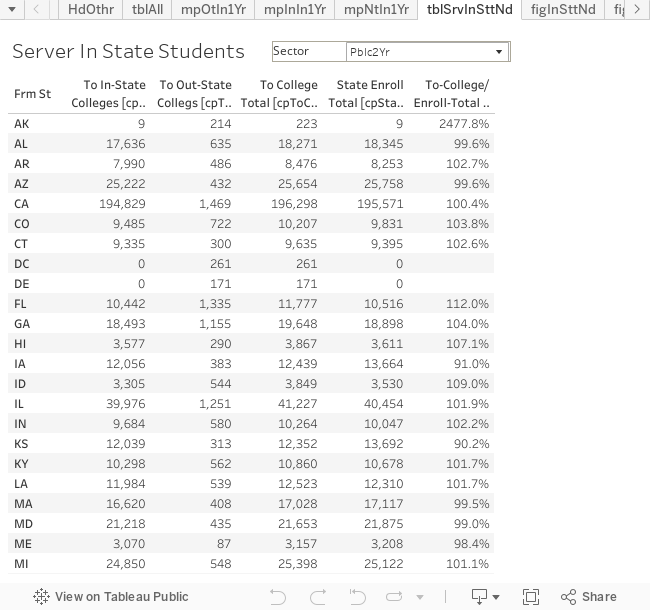
In Table 1, we listed few columns. The second, and the third columns listed college goers that went to in-state, and out-state colleges, while the fourth column provide the total college goers. The fifth column provides the total number of students enrolled in all colleges in the given State, regardless if those students are coming from in-state or out-of-state. We use this column as a measure of the state's enrollment capacity, i.e. the number of students a state's colleges can enroll. By taking the ratio between the college goer and the state capacity, we can see if a state can absorb all its college goers.

By setting the sector in Table 1 to public 4 year (Pblc4Yr), we can observ that Distric of Columbia (DC) simply do not have enough public-4-year institutions to serve its students. State of Illinois is in a similar situation. Fig. 5 below, ranked states based on this ratio from low to high.

Figure 5 - Ranking of Service In-State Needs
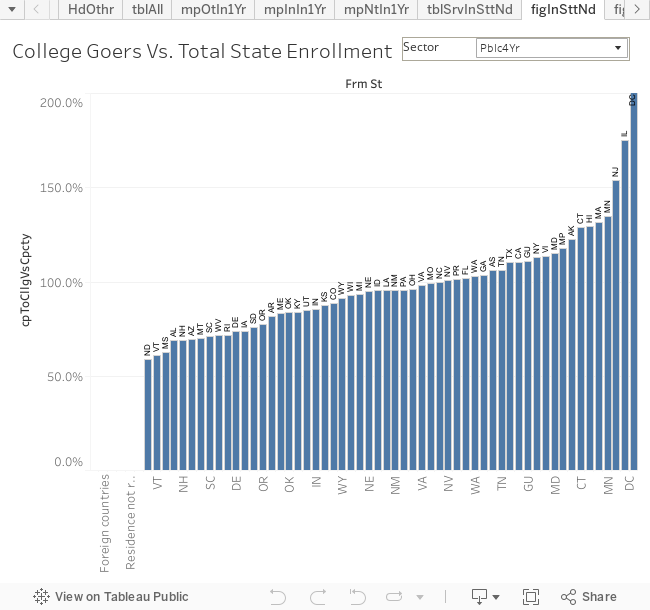
As a side note concerning the Illinois, it was observed in the youtube video: 'College data(Enrollment) States your students come from -IPEDS migration' that Nebraska observed considerable out-of-state students from Illinois. It is now obvious that, not just Nebraska, but there aught be few other States that observe similar phenomena, especially those surrounding Illinois.

Reader should also be cautioned that the In-State-Needs Served ratio should be used carefully. There could have states that most of their students are only interested in 2-year colleges. In that case, there is no need for a lot of 4-year institutions to fulfill the In-State-Needs for 4-year institutions. So, the capacity is relevent to the needs, not the absolute count.

For the convenience of the reader, a table is presented below for the public-4-year sector.

Table 2 - Serving In-State Needs (IPEDS Migration public-4-year institution)
From StateTotal College GoersIn-State CapacityGoers/Capacity
DC1,516467324.6%
IL39,16822,390174.9%
NJ32,66521,232153.8%
MN21,94416,304134.6%
MA20,93615,907131.6%
HI3,9963,093129.2%
CT12,3239,568128.8%
AK3,3882,767122.4%
MD18,40715,971115.3%
NY57,89651,273112.9%
CA144,800131,418110.2%
TX99,92390,772110.1%
TN21,14419,904106.2%
GA51,08349,313103.6%
WA32,17131,221103.0%
FL110,114108,130101.8%
NV13,39913,325100.6%
NC32,76832,87999.7%
MO19,35319,46699.4%
VA31,69832,32298.1%
OH48,48250,60595.8%
NM6,7897,09795.7%
PA43,12945,06195.7%
LA20,70021,65895.6%
ID5,7876,06595.4%
NE8,2138,64795.0%
MI44,12247,30593.3%
WI27,42829,61092.6%
WY1,2981,42391.2%
CO24,44927,62488.5%
KS11,03212,58087.7%
IN29,04433,91985.6%
UT16,05318,89085.0%
KY15,62418,64383.8%
OK14,36917,14883.8%
ME3,6784,40783.5%
AR12,05314,77181.6%
OR8,82011,40877.3%
SD3,9145,15875.9%
DE5,9428,07573.6%
IA9,65413,11373.6%
RI3,1364,38071.6%
WV7,85110,96771.6%
SC13,25318,70070.9%
MT4,4366,35469.8%
AZ16,76324,04969.7%
NH3,5675,15569.2%
AL17,19125,02068.7%
MS7,26811,59462.7%
VT1,9303,16461.0%
ND3,6106,10559.1%
AS415392105.9%
FM1700.0%
GU495446111.0%
MH400.0%
MP360305118.0%
PR12,65112,477101.4%
PW1300.0%
VI384338113.6%
Foreign countries41,06900.0%
State unknown5,23700.0%
Residence not reported3,71700.0%

Sunday, April 07, 2019

Online Courses Search - Private College Programs IPEDS 2016

Begin

Note: Information provided in this article is obtained from the project 'DataMaster -IPEDS'. Detail of the project can be found in Youtube, and EdPond articles.

Using Panels provided by this tool, readers can locate online courses offered by the private colleges of the United States. The project is hosted at the Tableau Public. For online program offered by the public colleges of the United States, please see this tools/application.

Through the years, based on US Education Department's IPEDS (Integrated Postsecondary Education System) survey, the per-cent of students involved in distance classes have increased in almost all sectors of 2-year and 4-year colleges. The recent trend from year 2012 to 2016 can be visualized in my previous article:
"IPEDS College Data - Online/Distance Education Enrollment Trend".

Even though not directly related, private institutions in the United States also provide opportunities for students to obtain degrees through distance education 'completely'. Based on IPEDS definition, a 'Distance Education Program' is a program for which all the required coursework for program completion is able to be completed via distance education courses, in which the instructional content is delivered exclusively via distance education. IPEDS' definition for 'Distance Education Course' do reserve the possibilities that students maybe asked to physically participate in some activities like testing, orientation, or academic support services. This can mean that, in reality, some of the degrees listed in this articles may not be completely feasible remotely.

Anyway, it is the intention of this article to provide a list of disciplines and colleges that were reported to IPEDS as 'Distance Education Program'. Students are cautioned to check the details with institutions before committed to work toward the degrees.

Given all the above, let's now look at the overall picture of the 'Distance Education Program' offered by United States' private institutions.

Based on the IPEDS data, there are total 14,909 distance education programs offered by United States' private institutions, 4-year or 2-year. Of these programs, 3,853 are in the Associate or Certificate level. At the Bachelor-degree level, there are 5,181 programs. At higher degree levels, there are 1,017, 4,453, 378, and 27 programs respectively for post-bachelor, master, post-master, and doctor degree.

Information about these distance education programs can be examined via the following interactive panels.

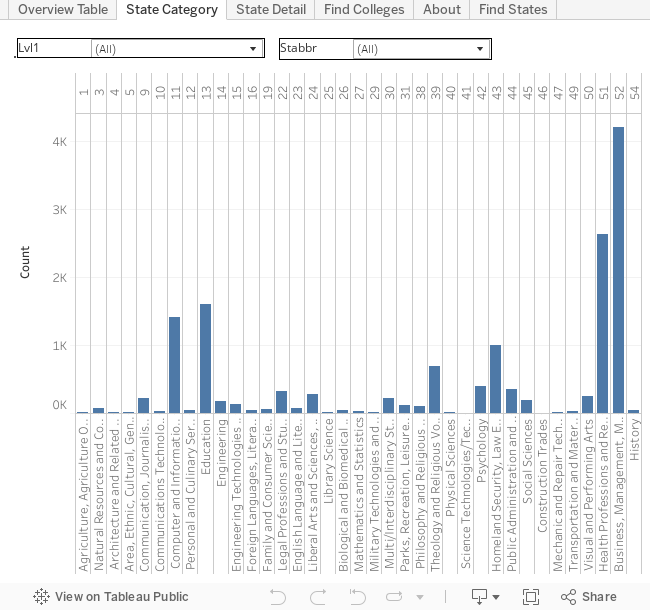
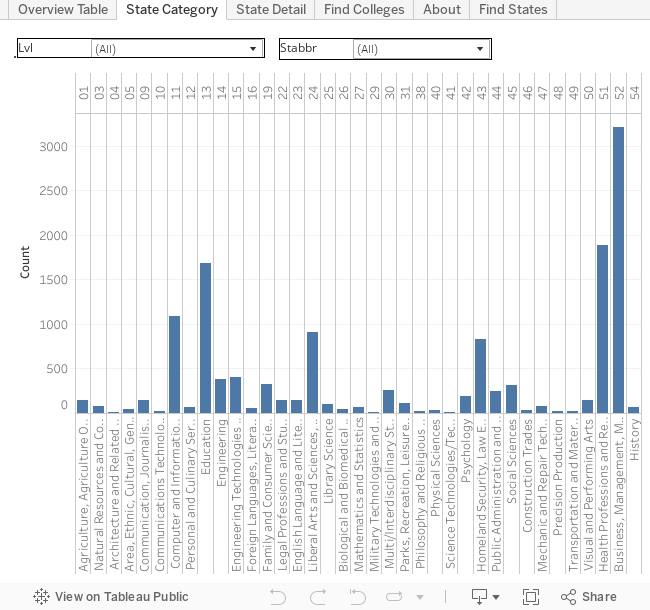
Panel 1 - State Category

In panel 1, by selecting the state of interest and the degree level, user can exam the number of (distance education) programs offered in each discipline branch, depicted by the two-digit CIP (Classification of Instructional Program) code. By selecting all levels and all states, it can be observed that most programs are offered at the category of CIP 52, the Business, followed by CIP 51, the Health, and CIP 13, the Education branch. Summing over all states, at the Associate and Certificate level, the CIP 11, the Computer, ranked 3rd instead of CIP 13, the Education. At the bachelor level, CIP 24, the Libral Art, comes before CIP 13, and ranked as the 3rd. At the post bachelor and master level, CIP 13 is way ahead of Business (CIP 52) and Health (CIP 51), where they are of similar magnitude and traded each other with levels. For the doctor level, there are only 3 CIPs: 51, 13, and 44 (social services).

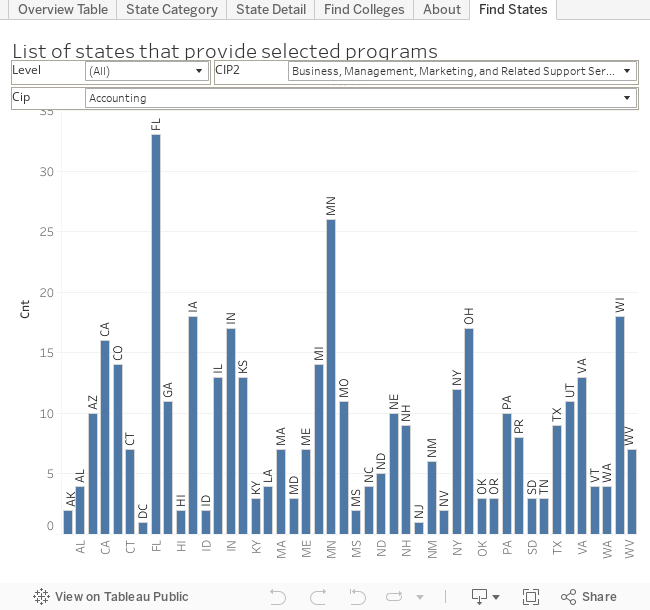
The state summary in Panel 1 is good if you are interested in in-state degrees. However, an online program being an online program is the freedom to enrolled from anywhere. In this case, searching from the program of interested maybe the way to go. Panel 2 shows exactly that.

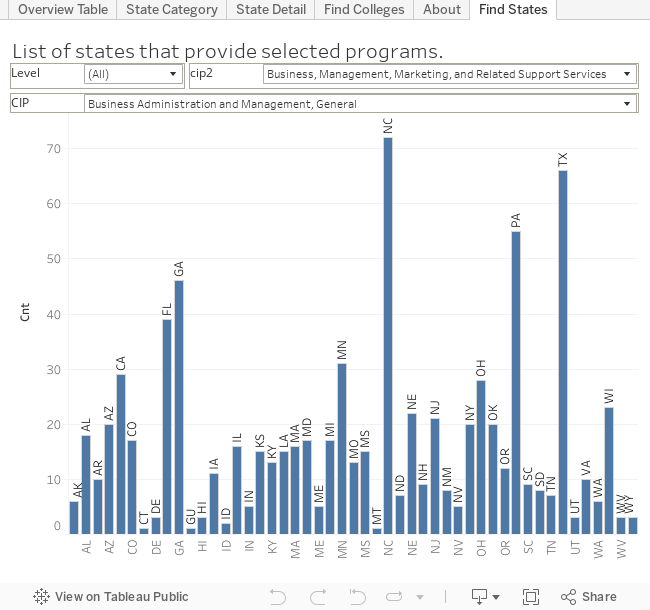
Panel 2 - Find States

In Panel 2, reader can select the degree level:
    Assoicate and Certificates (DeCrtAssct)
    Bachelor (DeBchlr)
    Post Bachelor Certificates (DePstBchlr)
    Master (DeMstr)
    Post Master Certificates (DePstMstr)
    Doctor (DeDctr)
, the two-digit cip category, and, then, the cip program title. This allows reader to see from which states the selected programs are available. With this information, reader can continue to find out which college/institution offering the particular program.

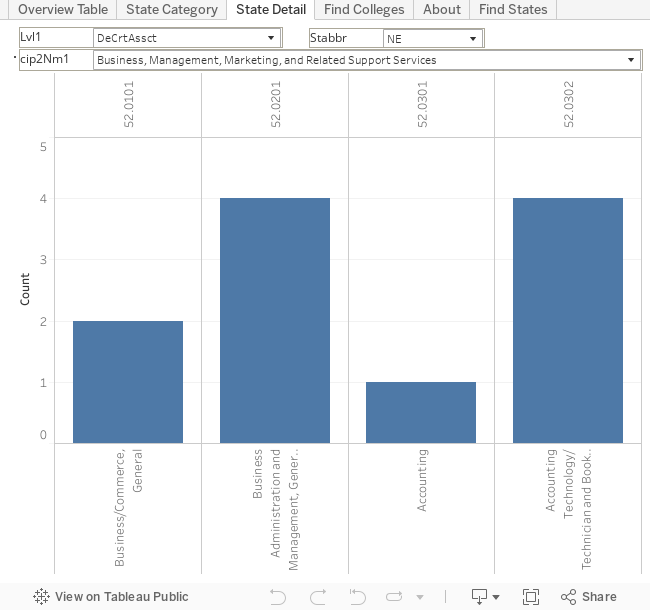
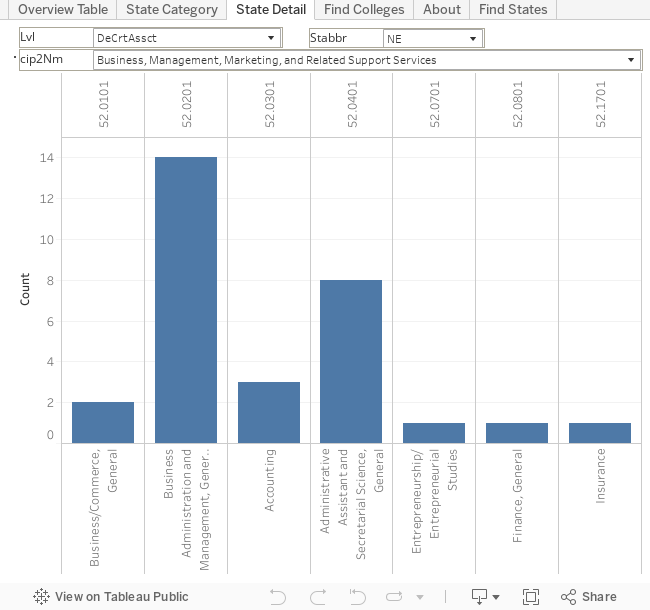
Panel 3 - State Detail

With this above panel, reader can find specific programs offered at the 6-digit CIP level - example are the Accounting training in the Business field (CIP 52).

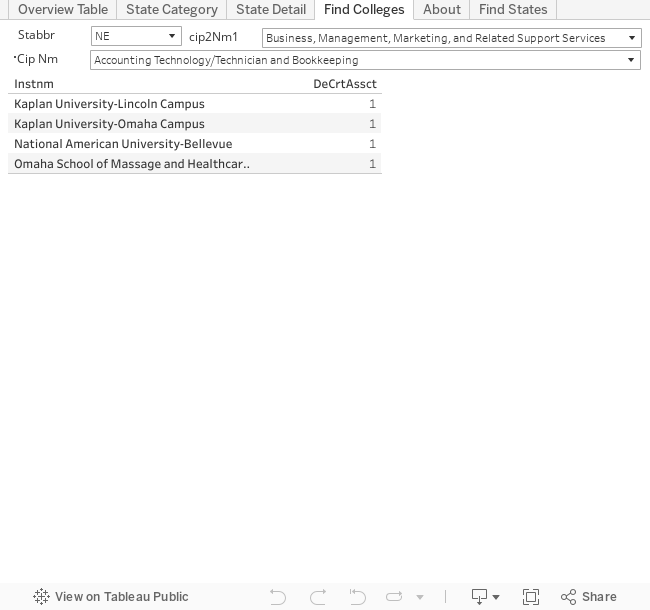
Panel 4 - Find college

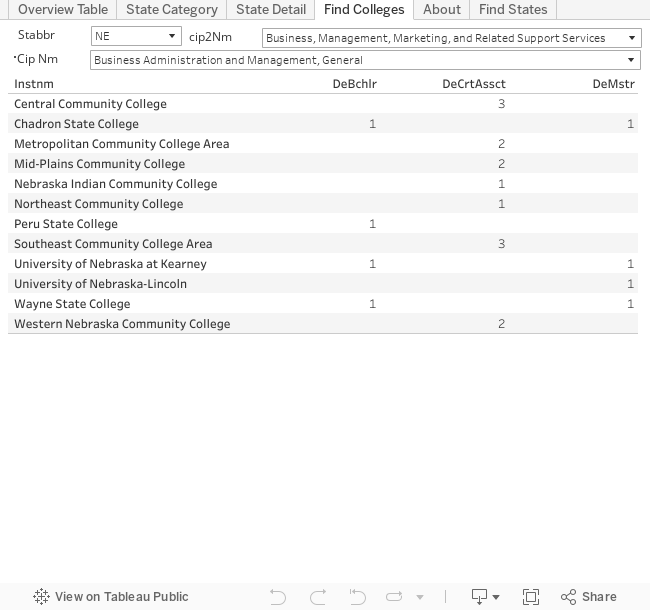
With Panel 4, reader can narrow their selection to the desired programs and the colleges that offered the programs.

Panel 5 - Overview Table

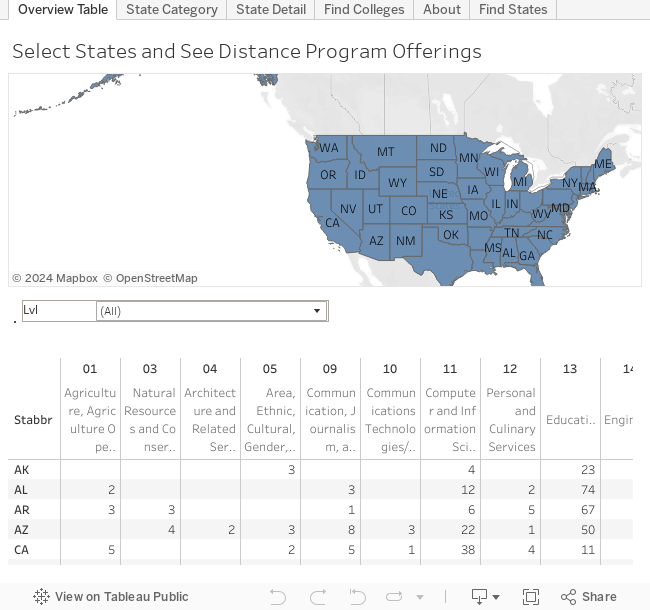
Panel 5 allows readers to compare program offered by each state. By selecting the desired states, readers can view program offerings side by side. For policy makers and higher education leaders, these data can be important in making decisions on what program to provide for the benefits of the society.

End

Monday, April 01, 2019

Online Courses Search - Public College Program IPEDS

Begin

Note: Information provided in this article is obtained from the project 'DataMaster -IPEDS'. Detail of the project can be found in Youtube, and EdPond articles.

Using Panels provided in this tool/article, readers can locate online courses( program) offered by the public colleges of the United States. The project is hosted at the Tableau Public. For online programs offered by the private colleges of the United States, please see this article.

Through the years, based on US Education Department's IPEDS (Integrated Postsecondary Education System) survey, the per-cent of students involved in distance classes have increased in almost all sectors of 2-year and 4-year colleges. The recent trend from year 2012 to 2016 can be visualized in my previous article:
"IPEDS College Data - Online/Distance Education Enrollment Trend".

Even though not directly related, public institutions in the United States also provide opportunities for students to obtain degrees through distance education 'completely'. Based on IPEDS definition, a 'Distance Education Program' is a program for which all the required coursework for program completion is able to be completed via distance education courses, in which the instructional content is delivered exclusively via distance education. IPEDS' definition for 'Distance Education Course' do reserve the possibilities that students maybe asked to physically participate in some activities like testing, orientation, or academic support services. This can mean that, in reality, some of the degrees listed in this articles may not be completely feasible remotely.

Anyway, it is the intention of this article to provide a list of disciplines and colleges that were reported to IPEDS as 'Distance Education Program'. Students are cautioned to check the details with institutions before committed to work toward the degrees.

Given all the above, let's now look at the overall picture of the 'Distance Education Program' offered by United States' public institutions.

Based on the IPEDS data, there are total 13,380 distance education programs offered by United States' public institutions, 4-year or 2-year. Of these programs, 7,264 are in the Associate or Certificate level. At the Bachelor-degree level, there are 2,105 programs. At higher degree levels, there are 945, 2,820, 241, and 5 programs respectively for post-bachelor, master, post-master, and doctor degree.

Information about these distance education programs can be examined via the following interactive panels.

Panel 1 - State Category

In panel 1, by selecting the state of interest and the degree level, user can exam the number of (distance education) programs offered in each discipline branch, depicted by the two-digit CIP (Classification of Instructional Program) code. By selecting all levels and all states, it can be observed that most programs are offered at the category of CIP 52, the Business, followed by CIP 51, the Health, and CIP 13, the Education branch. Summing over all states, at the Associate and Certificate level, the CIP 11, the Computer, ranked 3rd instead of CIP 13, the Education. At the bachelor level, CIP 24, the Libral Art, comes before CIP 13, and ranked as the 3rd. At the post bachelor and master level, CIP 13 is way ahead of Business (CIP 52) and Health (CIP 51), where they are of similar magnitude and traded each other with levels. For the doctor level, there are only 3 CIPs: 51, 13, and 44 (social services).

The state summary in Panel 1 is good if you are interested in in-state degrees. However, an online program being an online program is the freedom to enrolled from anywhere. In this case, searching from the program of interested maybe the way to go. Panel 2 shows exactly that.

Panel 2 - Find States

In Panel 2, reader can select the degree level:
    Assoicate and Certificates (DeCrtAssct)
    Bachelor (DeBchlr)
    Post Bachelor Certificates (DePstBchlr)
    Master (DeMstr)
    Post Master Certificates (DePstMstr)
    Doctor (DeDctr)
, the two-digit cip category, and, then, the cip program title. This allows reader to see from which states the selected programs are available. With this information, reader can continue to find out which college/institution offering the particular program.

Panel 3 - State Detail

With this above panel, reader can find specific programs offered at the 6-digit CIP level - example are the Accounting training in the Business field (CIP 52).

Panel 4 - Find college

With Panel 4, reader can narrow their selection to the desired programs and the colleges that offered the programs.

Panel 5 - Overview Table

Panel 5 allows readers to compare program offered by each state. By selecting the desired states, readers can view program offerings side by side. For policy makers and higher education leaders, these data can be important in making decisions on what program to provide for the benefits of the society.

End

Wednesday, February 06, 2019

College Search, a tool and tutorial on using IPEDS college data

Begin
IPEDS (Integrated Postsecondary Education Data System) data is a vital data source for learning about colleges in the United States. As indicated in my previous articles, a good tool/program/application is very important in making a data usable.


In my previous article, I talked about how to use a program to monitoring the performance of peer institutions. In this article, I will go through the details of using the application to access IPEDS data and search for desired colleges/institutions. The process has many implications. For one, it can be used by high school graduates to search for college of interest. The same process can also be used by institution researchers in looking for potential peer institutions.

Information on the tool/program/application I used can be found at: IPEDS College Data UI and API project. The one interested for this article is: College Search - IPEDS data for High School Graduates + Researcher.


Before we begin, we need understand that when using any dataset, it is always important to have some basic knowledge about the industry/subject. For IPEDS, or, college/higher-education in the United States, these can include how institutions are classified and how these classification can change. For this article, what we need to understand is that institution can change - control, ownership included, and when searching them, it is important to look for them at a specific point in time, say, year. What you learn about an institution in one year, may or may not be hold for other years.

Back to the topic, the program we are going to look at has many uses. For this article, we will concentrate on just one tab/function - the institution tab. Under the institution tab, there are five sub-tabs that each provides well defined purposes to guide user to accomplish their goals.


The first sub-tab is the 'basic' sub-tab. The most important function for this tab is to establish the year of interest. User begin by searching the database for all years that are available and, then, select the year of interest. Once the year is selected, this tab also provide simple filter to limited the scope of search. Available options are detailed to assist user to make decisions.

After the basic categorical filter been applied, quantitative filtering can be applied by moving to the measures sub-tab. In this sub-tab, users can iteratively search and select the measures/quantities that are interested to them.

Once the measures of interest were selected, the Variable sub-tab is ready. In this tab,user get a chance to further qualify the measure/quantity they selected. For example, user maybe looking a the quantity of part-time enrolled male students while the qualifying 'factor' can be students levels, like undergraduate, or graduate students. By selecting applicable qualifying options and assign a name, a 'user-measure' is created ... like part-time-under-men, part-time-men-under-plus-graduate, ... etc.

With fully defined 'user-measures', user can now set the 'quantitative filters'. By moving to the Query sub-tab and typing in things like: part-time-under-men>1000 or
part-time-under-men/part-time-men-under-plus-graduate > 0.5, user can select institutions that met those criteria.

After the execution of the Query sub-tab, institutions found are appended to UnitId sub-tab. From there, you can retrieve the basic identity information of each selected institutions.

Once institutions were decided, user can use other major tabs to retrieve trend data about these institution and present these data in charts. For example: College Data Search - IPEDS tool for Peer Institutions Monitoring, the video and College Data Search, a tool - Monitoring Peer Institutions, the article.

As mentioned in the video, the process is very general. It can easily apply to any measures in the IPEDS database. The process also support the combination of measures and criteria. For example, user can even check if an institution's student minority ratio is higher than faculty's minority ratio.

End

Friday, February 01, 2019

College Data Search, an IPEDS tool - Monitoring Peer Institutions

Begin

IPEDS (Integrated Postsecondary Education Data System) data, without doubt, can be considered as the most important data source for United States' postsecondary education. However, even though IPEDS made efforts to make the data accessible to general public, barriers for using and analyzing those data are still high.

As described in my previous articles(IPEDS College Data - Distance Education Enrollment Trend, Higher Education IPEDS College Data UI and RESTful API - defnition, charting, demonstration) and youtube videos(IPEDS College Data UI and API project), at this moment, I am personally developing a data system that will make accessing to IPEDS data easier.

My most recent video that demonstrated the recent improved to my app/program can be found at the Youtube.com: College Data Search - IPEDS tool for Peer Institutions Monitoring


The video demonstrated how to use the app/program to monitor the status of a list of institutions over time. In our particular case, we use the peer institutions list of the Indiana University at Bloomington. The list can be obtained directly from Indiana University's web site: http://uirr.iu.edu/index.html

As is demonstrated by the video, Indiana University at Bloomington has the highest number of undergraduate degree-seeking enrollment headcount comparing to all its peers. On the other hand, the percent of students that took on-line classes ranked Indiana University the third from the last among its peers (year 2016).

One institution also stand out from the video. As shown in the video, the University of Texas at Arlington started out as an plausible peer of the Indiana University at Bloomington even though it did have the highest number of online students. Over the years, however, it is obvious that the University of Texas at Arlington has taken an initiative that grown its online community way faster than the rest of the institutions, including Indiana University at Bloomington.

The video also try to make few points on the peer institution selection. As pointed out, the most important thing in selecting peer institutions is look at the restrictions or constrains. In the case of the out-of-state online enrollment, one possible restriction would be the mission of the institution. For example, if the Indiana University at Bloomington was limited by either the public opinion or the legislature to focus its resources on in-state students while the University of Texas at Arlington is not. The two institutions, then, should not be considered peers even if they have the similar resources to operate.

With the improvement done to the app/program, an upcoming video will demonstrate a way to select institutions based on profiles - a process that helps selecting possible peer institutions. That same process can also be used by high school graduates looking for similar institutions that meet their college expectations.

Please visit my video and feel free to comment on it. For one, any indication of interest in the program will drive me to put more time into the project.

 End

Monday, November 12, 2018

Online Education Statistics (IPEDS Enrollment Trend)


If you are looking for online program offered by United States' public colleges, please use this online search tool/application to find colleges offering them.

With higher education continuing to be considered the footstep to reaching personal economic sufficiency, the demand for postsecondary education continues to grow. With the growing demands, governments, states, private companies, and institutions were working hard to capitalize and meet the demands. Distance education, with its nature, overcome several traditional higher education limitations.

Basic statistics of the distance education in United States were published in the 'Digest of Education Statistics' by National Center for Education Statistics (NCES). The most recent summary table published can be found here.

The table presents national level data with sector break down using the preliminary 2016 IPEDS (Integrated Postsecondary Education Data System) data published back in Feb. 2018. The table shows two years (2015 and 2016) of data, which are of limited use in showing the trends.

The purpose of this article is to fill the gaps and present some trend data using the 'data master' data system developed by the author. Information about the data system can be found at the ITTidbit, the Youtube, and the Vimeo.

For this article, I will be dealing with the National level data only as opposed to State level data, which will be dealt with in separate articles. The data presented here would be an enhancement to the basic statistics published by NCES in terms of the years of coverage, the break down of categories, and the revision of the data. The data used are revisions published by IPEDS as of Oct. 24, 2018.

The general observations of the data are:
  1. For degree-seeking students (include graduate students), which is the majority of undergraduates, the fraction of students taking online classes continue to grow.
  2. For 4-year schools, public and private not-for-profit schools, the number of students taking online classes are continue to grow.
  3. For 4-year degree seeking, private for-profit schools show high degree use of distance education - 65-80% vs. 15-30% for public and private not-for profit schools.

DC+50States of US; 4-year Inst.; Undergraduate Total; Any Online Course;

  Head Count : (4-year; Under)
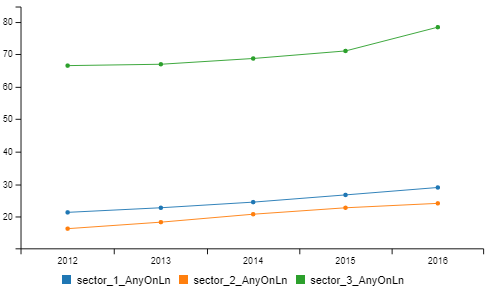
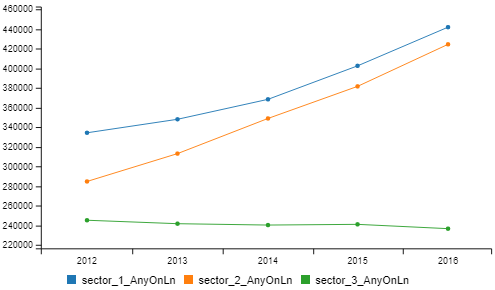
The chart above presents the enrollment headcount for undergraduate students that taking any online course in 4-year institutions located in the DC or the 50 states of United States. The blue line represents the public 4-year institutions while the orange line represents the private not-for-profit 4-year institutions. The green line represents the private for profit 4-year institutions.

  Percent of Undergraduate Enrollment : (4-year; Under)
Head count is important, but it does not tell the whole story. Percent of total enrollment provides a different level of details. As shown in this above chart, the private for-profit institution (green line) actually utilized the distance education to higher degree while the public 4-year institution (blue line) comes next even though it has more students as shown in previous chart.

DC+50States of US; 4-year Inst.; Undergraduate Degree Seeking; Any Online Course;

  Head Count : (4-year; Under; Degree Seeking)

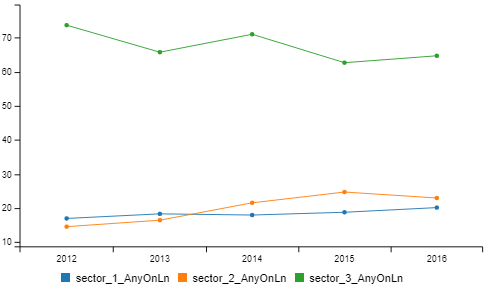
The chart above presents the enrollment headcount for undergraduate degree seeking students that taking any online course in 4-year institutions located in the DC or the 50 states of United States. The blue line represents the public 4-year institutions while the orange line represents the private not-for-profit 4-year institutions. The green line represents the private for profit 4-year institutions.

  Percent of Undergraduate Degree Seeking Student : (4-year)

DC+50States of US; 4-year Inst.; Undergraduate non-Degree Seeking; Any Online Course;

  Head Count : (4-year; Under; non-degree seeking)

  Percent of Undergraduate non-Degree Seeking students: (4-year)


DC+50States of US; 4-year Inst.; Graduate; Any Online Course;

  Head Count : (4-year; Graduate students)

The chart above presents the enrollment headcount for graduate students that taking any online course in 4-year institutions located in the DC or the 50 states of United States. The blue line represents the public 4-year institutions while the orange line represents the private not-for-profit 4-year institutions. The green line represents the private for profit 4-year institutions.

  Percent of Graduate enrollment : (4-year)


DC+50States of US; 2-year Inst.; enroll total; Any Online Course;

  Head Count : (2-year; enroll total)

The chart above presents the enrollment headcount for undergraduate students that taking any online course in 2-year institutions located in the DC or the 50 states of United States. The blue line represents the public 2-year institutions while the orange line represents the private not-for-profit 2-year institutions. The green line represents the private for profit 2-year institutions. One thing stand out in this chart is that the public 2-year institutions have much more students than that of private 2-year institutions.

   Percent of enrollment total : (2-year)


DC+50States of US; 2-year Inst.; degree seeking; Any Online Course;

  Head Count : (2-year; degree seeking)
Again, comparing with previous chart, it shows that majority undergraduate students are degree seeking students. For data concerning non-degree seeking students, please see the following section.

   Percent of degree seeking students : (2-year)
   
DC+50States of US; 2-year Inst.; non-degree seeking; Any Online Course;

  Head Count : (2-year; non-degree seeking)

   Percent of non-degree seeking students : (2-year)


=============

Data published by NCES Digest of Education Statistics:
  • Compare with private, public institution show less (%) distance students. Also less (%) exclusive distance students.
  • Compare with graduate, undergraduate show less (%) exclusive students but more none-exclusive students.
  • For profits shows much more exclusive students (4-year) - I assuming 2-year of smaller scale and not enthusiasm about distance ed.
  • 2 year, in general, more exclusive.
  • public has more in-state than out-of-state; private, the reverse is true. 
Data in general show the growing trend on distance/on-line education.
For public institution, because of the mission of educate state residents, public institution, in general, enrolls state residence and, therefore, less students from out of state and less students taking distance education courses from out of state.

It, however, can be a strategy move for public institution to accept out of state students if the capacity is allowed and to recover the cost of development.

It is also interested to see if it is possible to relate fields distribution to the number of students taking online courses since, likely, some fields are more suitable for online presentation.

From policy point of view, it may not be easy to make arguments with simple head count distribution since there are many factors in deciding what is an appropriate % of online courses.

Distance education, by definition, allow students to take courses away from the campus and, in that way, reduces spaces requirement. On the other hand, the requirement for staff's time may not reduced - staff will be transferred to work on tutorial duties. In a sense, you increase the quality in liue of reduce cost.

Serve the public - student body - the whole state.
How privates contributes.

Institution size - related to distance ed. - Serve each other institution.


 here