Monday, April 15, 2019

Find Where Students Went To Colleges? IPEDS Migration Enrollment

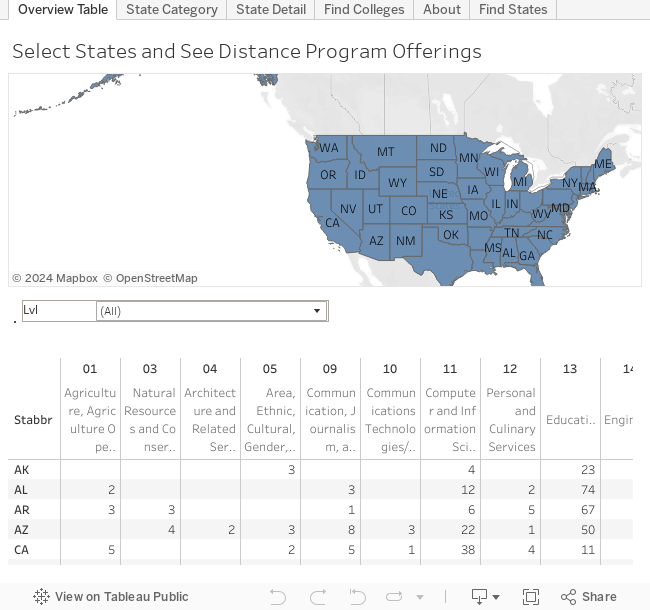
As a state higher education stakeholder, it will be interesting to know where your college going students went for colleges. Knowing that information can help making policies to either keep students in the state or make the best usage of state resources. The National IPEDS (Integrated Postsecondary Education Data System) survey provided you exactly these information.

For beginner, let's understand how those data were collected. Basically, the IPEDS survey will asked each college/institution to provide information about which State their first-time degree seeking students come from. At the same time, they also asked colleges to separate those students into two groups: One for those graduated from higher school within one year of college attendance and the other for those high school students that waited longer than one year after graduating before enrolled in a college.

By building a data system that hosting these data at the national level, it is possible to see, for a given State, where their college going students went for colleges. Info on a system that provids the data for this article/application and is built to handle IPEDS data at the national level can be found at 'the IT tidbit blog'
with related tutorial/demonstration video posted at: Youtube.com.

This article/application will provide you the knowledge and tools on how to find the migration information at the state level. For detailed information down to the college/institution level, please see the following youtube videos:
College data(Enrollment) States your students come from -IPEDS migration and
IPEDS Nebraska Enrollment Migration College Data
The first video exams which states Nebraska's college students came from and to which institution these students went. The second video shows to which state or institution Nebraska's students went.

For this article, the application is hosted at the Tableau Public and is concerned about state level analysis only. Let's begin with the out-migration first. The out-migration provides reader/user the information about where your college going students went for colleges. Fig. 1 displays exactly that information for students just graduated from high school that attend colleges within 12 months of their graduation.

Figure 1 - Out Migration

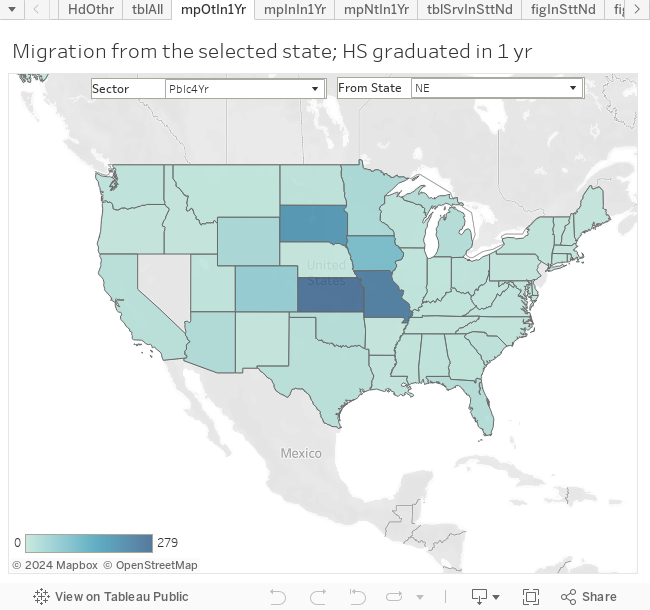
In Fig. 1, if you select public 4 year institution as the sector (Pblc4Yr) and select Nebraska (NE) as the 'From state', you can see Nebraska is sending 279 students to the neighboring state of Kansas (KS).

To get an overall picture, Fig. 2 below provides a way to see the percentage of college goers that are attending the in-state colleges.

Figure 2 - % College Goers Attend In-State Colleges

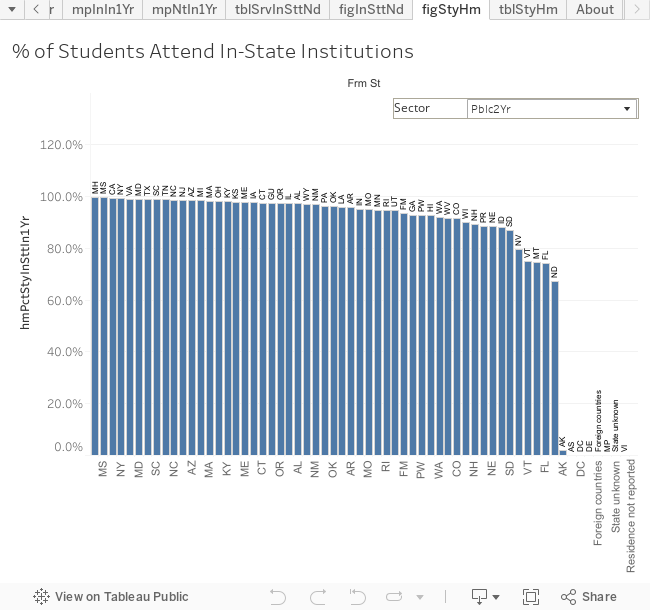
By setting the sector to public-2-year (Pblc2Yr) in Fig. 2, we can observe that for most States, the in-state attendance is around 100% and which is understandable since community colleges were intended to serve local communities. Few exceptions do exist: AK (Alaska), DC (District of Columbia, and DE (Delaware). For Alaska, there is a single public 2 year college: Ilisagvik College. For DC and DE, there is none.

Next, let's exam the number of students that migrated/moved to a particular State. This can be done with the Fig. 3

Figure 3 - In Migration

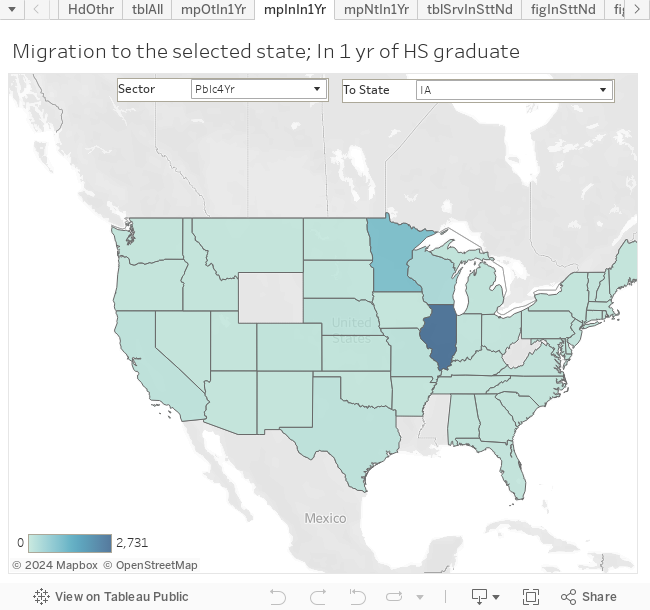
In the case of Fig. 3, if we set the sector to public 4 year(Pblc4Yr) and the 'To state' to IA (Iowa), we notice that there are 2,731 students that left Illinois (IL) and enrolled in Iowa (IA) colleges/institutions.

The next question the readers may have might be... So.. In the Net, if Nebraska lose or gain students from, say, Iowa (IA)? This is exactly what the Fig. 4 can show you.

Figure 4 - Net In-Migration

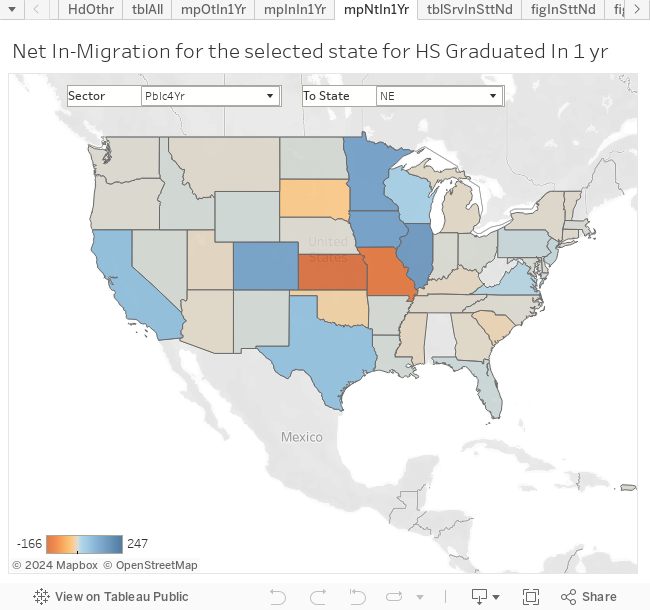
As shown with Fig. 4, Nebraska (NE), in the case of public 4 year (Pblc4Yr), actually gain 137 students from Iowa (IA).

All of the cases about, we are concentrated on students that attend colleges within one year of them graduated from the high schools. Part of the reason is that these are the majority of the students and, also, these are what policy maker may have more influences on.

The next question you might wondering is: if a state do intend to retain all of their college goers, do the state has enough 'space/enrollment-spot' to host all their college goers. There might be other ways to address this question. However, with the data at hand, we intended to answer this question with the Table 1 below.

Table 1 - Serve In-State Needs

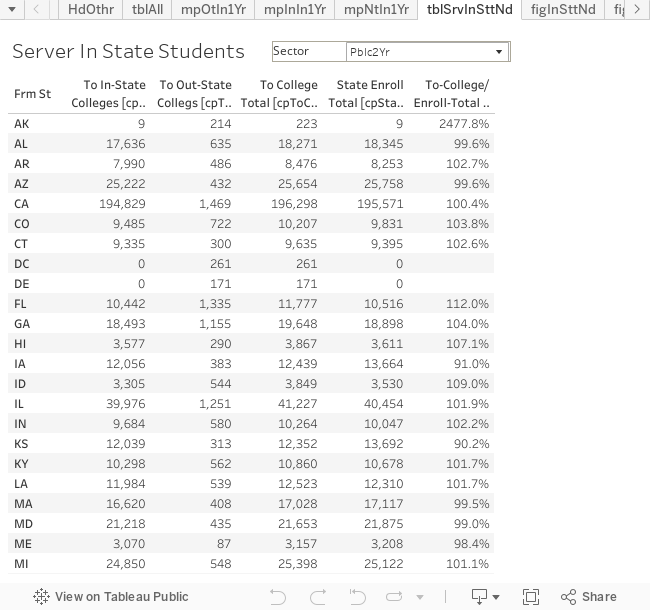
In Table 1, we listed few columns. The second, and the third columns listed college goers that went to in-state, and out-state colleges, while the fourth column provide the total college goers. The fifth column provides the total number of students enrolled in all colleges in the given State, regardless if those students are coming from in-state or out-of-state. We use this column as a measure of the state's enrollment capacity, i.e. the number of students a state's colleges can enroll. By taking the ratio between the college goer and the state capacity, we can see if a state can absorb all its college goers.

By setting the sector in Table 1 to public 4 year (Pblc4Yr), we can observ that Distric of Columbia (DC) simply do not have enough public-4-year institutions to serve its students. State of Illinois is in a similar situation. Fig. 5 below, ranked states based on this ratio from low to high.

Figure 5 - Ranking of Service In-State Needs

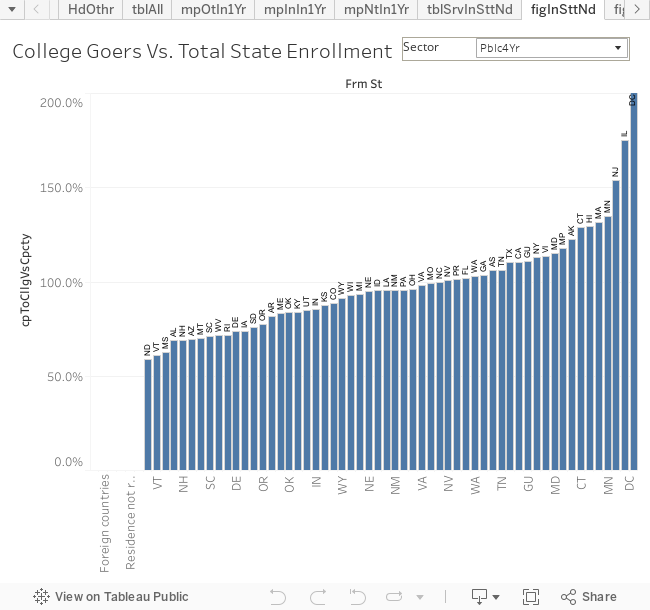
As a side note concerning the Illinois, it was observed in the youtube video: 'College data(Enrollment) States your students come from -IPEDS migration' that Nebraska observed considerable out-of-state students from Illinois. It is now obvious that, not just Nebraska, but there aught be few other States that observe similar phenomena, especially those surrounding Illinois.

Reader should also be cautioned that the In-State-Needs Served ratio should be used carefully. There could have states that most of their students are only interested in 2-year colleges. In that case, there is no need for a lot of 4-year institutions to fulfill the In-State-Needs for 4-year institutions. So, the capacity is relevent to the needs, not the absolute count.

For the convenience of the reader, a table is presented below for the public-4-year sector.

Table 2 - Serving In-State Needs (IPEDS Migration public-4-year institution)
From StateTotal College GoersIn-State CapacityGoers/Capacity
DC1,516467324.6%
IL39,16822,390174.9%
NJ32,66521,232153.8%
MN21,94416,304134.6%
MA20,93615,907131.6%
HI3,9963,093129.2%
CT12,3239,568128.8%
AK3,3882,767122.4%
MD18,40715,971115.3%
NY57,89651,273112.9%
CA144,800131,418110.2%
TX99,92390,772110.1%
TN21,14419,904106.2%
GA51,08349,313103.6%
WA32,17131,221103.0%
FL110,114108,130101.8%
NV13,39913,325100.6%
NC32,76832,87999.7%
MO19,35319,46699.4%
VA31,69832,32298.1%
OH48,48250,60595.8%
NM6,7897,09795.7%
PA43,12945,06195.7%
LA20,70021,65895.6%
ID5,7876,06595.4%
NE8,2138,64795.0%
MI44,12247,30593.3%
WI27,42829,61092.6%
WY1,2981,42391.2%
CO24,44927,62488.5%
KS11,03212,58087.7%
IN29,04433,91985.6%
UT16,05318,89085.0%
KY15,62418,64383.8%
OK14,36917,14883.8%
ME3,6784,40783.5%
AR12,05314,77181.6%
OR8,82011,40877.3%
SD3,9145,15875.9%
DE5,9428,07573.6%
IA9,65413,11373.6%
RI3,1364,38071.6%
WV7,85110,96771.6%
SC13,25318,70070.9%
MT4,4366,35469.8%
AZ16,76324,04969.7%
NH3,5675,15569.2%
AL17,19125,02068.7%
MS7,26811,59462.7%
VT1,9303,16461.0%
ND3,6106,10559.1%
AS415392105.9%
FM1700.0%
GU495446111.0%
MH400.0%
MP360305118.0%
PR12,65112,477101.4%
PW1300.0%
VI384338113.6%
Foreign countries41,06900.0%
State unknown5,23700.0%
Residence not reported3,71700.0%

Sunday, April 07, 2019

Online Courses Search - Private College Programs IPEDS 2016

Begin

Note: Information provided in this article is obtained from the project 'DataMaster -IPEDS'. Detail of the project can be found in Youtube, and EdPond articles.

Using Panels provided by this tool, readers can locate online courses offered by the private colleges of the United States. The project is hosted at the Tableau Public. For online program offered by the public colleges of the United States, please see this tools/application.

Through the years, based on US Education Department's IPEDS (Integrated Postsecondary Education System) survey, the per-cent of students involved in distance classes have increased in almost all sectors of 2-year and 4-year colleges. The recent trend from year 2012 to 2016 can be visualized in my previous article:
"IPEDS College Data - Online/Distance Education Enrollment Trend".

Even though not directly related, private institutions in the United States also provide opportunities for students to obtain degrees through distance education 'completely'. Based on IPEDS definition, a 'Distance Education Program' is a program for which all the required coursework for program completion is able to be completed via distance education courses, in which the instructional content is delivered exclusively via distance education. IPEDS' definition for 'Distance Education Course' do reserve the possibilities that students maybe asked to physically participate in some activities like testing, orientation, or academic support services. This can mean that, in reality, some of the degrees listed in this articles may not be completely feasible remotely.

Anyway, it is the intention of this article to provide a list of disciplines and colleges that were reported to IPEDS as 'Distance Education Program'. Students are cautioned to check the details with institutions before committed to work toward the degrees.

Given all the above, let's now look at the overall picture of the 'Distance Education Program' offered by United States' private institutions.

Based on the IPEDS data, there are total 14,909 distance education programs offered by United States' private institutions, 4-year or 2-year. Of these programs, 3,853 are in the Associate or Certificate level. At the Bachelor-degree level, there are 5,181 programs. At higher degree levels, there are 1,017, 4,453, 378, and 27 programs respectively for post-bachelor, master, post-master, and doctor degree.

Information about these distance education programs can be examined via the following interactive panels.

Panel 1 - State Category

In panel 1, by selecting the state of interest and the degree level, user can exam the number of (distance education) programs offered in each discipline branch, depicted by the two-digit CIP (Classification of Instructional Program) code. By selecting all levels and all states, it can be observed that most programs are offered at the category of CIP 52, the Business, followed by CIP 51, the Health, and CIP 13, the Education branch. Summing over all states, at the Associate and Certificate level, the CIP 11, the Computer, ranked 3rd instead of CIP 13, the Education. At the bachelor level, CIP 24, the Libral Art, comes before CIP 13, and ranked as the 3rd. At the post bachelor and master level, CIP 13 is way ahead of Business (CIP 52) and Health (CIP 51), where they are of similar magnitude and traded each other with levels. For the doctor level, there are only 3 CIPs: 51, 13, and 44 (social services).

The state summary in Panel 1 is good if you are interested in in-state degrees. However, an online program being an online program is the freedom to enrolled from anywhere. In this case, searching from the program of interested maybe the way to go. Panel 2 shows exactly that.

Panel 2 - Find States

In Panel 2, reader can select the degree level:
    Assoicate and Certificates (DeCrtAssct)
    Bachelor (DeBchlr)
    Post Bachelor Certificates (DePstBchlr)
    Master (DeMstr)
    Post Master Certificates (DePstMstr)
    Doctor (DeDctr)
, the two-digit cip category, and, then, the cip program title. This allows reader to see from which states the selected programs are available. With this information, reader can continue to find out which college/institution offering the particular program.

Panel 3 - State Detail

With this above panel, reader can find specific programs offered at the 6-digit CIP level - example are the Accounting training in the Business field (CIP 52).

Panel 4 - Find college

With Panel 4, reader can narrow their selection to the desired programs and the colleges that offered the programs.

Panel 5 - Overview Table

Panel 5 allows readers to compare program offered by each state. By selecting the desired states, readers can view program offerings side by side. For policy makers and higher education leaders, these data can be important in making decisions on what program to provide for the benefits of the society.

End

Monday, April 01, 2019

Online Courses Search - Public College Program IPEDS

Begin

Note: Information provided in this article is obtained from the project 'DataMaster -IPEDS'. Detail of the project can be found in Youtube, and EdPond articles.

Using Panels provided in this tool/article, readers can locate online courses( program) offered by the public colleges of the United States. The project is hosted at the Tableau Public. For online programs offered by the private colleges of the United States, please see this article.

Through the years, based on US Education Department's IPEDS (Integrated Postsecondary Education System) survey, the per-cent of students involved in distance classes have increased in almost all sectors of 2-year and 4-year colleges. The recent trend from year 2012 to 2016 can be visualized in my previous article:
"IPEDS College Data - Online/Distance Education Enrollment Trend".

Even though not directly related, public institutions in the United States also provide opportunities for students to obtain degrees through distance education 'completely'. Based on IPEDS definition, a 'Distance Education Program' is a program for which all the required coursework for program completion is able to be completed via distance education courses, in which the instructional content is delivered exclusively via distance education. IPEDS' definition for 'Distance Education Course' do reserve the possibilities that students maybe asked to physically participate in some activities like testing, orientation, or academic support services. This can mean that, in reality, some of the degrees listed in this articles may not be completely feasible remotely.

Anyway, it is the intention of this article to provide a list of disciplines and colleges that were reported to IPEDS as 'Distance Education Program'. Students are cautioned to check the details with institutions before committed to work toward the degrees.

Given all the above, let's now look at the overall picture of the 'Distance Education Program' offered by United States' public institutions.

Based on the IPEDS data, there are total 13,380 distance education programs offered by United States' public institutions, 4-year or 2-year. Of these programs, 7,264 are in the Associate or Certificate level. At the Bachelor-degree level, there are 2,105 programs. At higher degree levels, there are 945, 2,820, 241, and 5 programs respectively for post-bachelor, master, post-master, and doctor degree.

Information about these distance education programs can be examined via the following interactive panels.

Panel 1 - State Category

In panel 1, by selecting the state of interest and the degree level, user can exam the number of (distance education) programs offered in each discipline branch, depicted by the two-digit CIP (Classification of Instructional Program) code. By selecting all levels and all states, it can be observed that most programs are offered at the category of CIP 52, the Business, followed by CIP 51, the Health, and CIP 13, the Education branch. Summing over all states, at the Associate and Certificate level, the CIP 11, the Computer, ranked 3rd instead of CIP 13, the Education. At the bachelor level, CIP 24, the Libral Art, comes before CIP 13, and ranked as the 3rd. At the post bachelor and master level, CIP 13 is way ahead of Business (CIP 52) and Health (CIP 51), where they are of similar magnitude and traded each other with levels. For the doctor level, there are only 3 CIPs: 51, 13, and 44 (social services).

The state summary in Panel 1 is good if you are interested in in-state degrees. However, an online program being an online program is the freedom to enrolled from anywhere. In this case, searching from the program of interested maybe the way to go. Panel 2 shows exactly that.

Panel 2 - Find States

In Panel 2, reader can select the degree level:
    Assoicate and Certificates (DeCrtAssct)
    Bachelor (DeBchlr)
    Post Bachelor Certificates (DePstBchlr)
    Master (DeMstr)
    Post Master Certificates (DePstMstr)
    Doctor (DeDctr)
, the two-digit cip category, and, then, the cip program title. This allows reader to see from which states the selected programs are available. With this information, reader can continue to find out which college/institution offering the particular program.

Panel 3 - State Detail

With this above panel, reader can find specific programs offered at the 6-digit CIP level - example are the Accounting training in the Business field (CIP 52).

Panel 4 - Find college

With Panel 4, reader can narrow their selection to the desired programs and the colleges that offered the programs.

Panel 5 - Overview Table

Panel 5 allows readers to compare program offered by each state. By selecting the desired states, readers can view program offerings side by side. For policy makers and higher education leaders, these data can be important in making decisions on what program to provide for the benefits of the society.

End