Showing posts with label college. Show all posts

Monday, April 01, 2019

Online Courses Search - Public College Program IPEDS

Begin

Note: Information provided in this article is obtained from the project 'DataMaster -IPEDS'. Detail of the project can be found in Youtube, and EdPond articles.

Using Panels provided in this tool/article, readers can locate online courses( program) offered by the public colleges of the United States. The project is hosted at the Tableau Public. For online programs offered by the private colleges of the United States, please see this article.

Through the years, based on US Education Department's IPEDS (Integrated Postsecondary Education System) survey, the per-cent of students involved in distance classes have increased in almost all sectors of 2-year and 4-year colleges. The recent trend from year 2012 to 2016 can be visualized in my previous article:
"IPEDS College Data - Online/Distance Education Enrollment Trend".

Even though not directly related, public institutions in the United States also provide opportunities for students to obtain degrees through distance education 'completely'. Based on IPEDS definition, a 'Distance Education Program' is a program for which all the required coursework for program completion is able to be completed via distance education courses, in which the instructional content is delivered exclusively via distance education. IPEDS' definition for 'Distance Education Course' do reserve the possibilities that students maybe asked to physically participate in some activities like testing, orientation, or academic support services. This can mean that, in reality, some of the degrees listed in this articles may not be completely feasible remotely.

Anyway, it is the intention of this article to provide a list of disciplines and colleges that were reported to IPEDS as 'Distance Education Program'. Students are cautioned to check the details with institutions before committed to work toward the degrees.

Given all the above, let's now look at the overall picture of the 'Distance Education Program' offered by United States' public institutions.

Based on the IPEDS data, there are total 13,380 distance education programs offered by United States' public institutions, 4-year or 2-year. Of these programs, 7,264 are in the Associate or Certificate level. At the Bachelor-degree level, there are 2,105 programs. At higher degree levels, there are 945, 2,820, 241, and 5 programs respectively for post-bachelor, master, post-master, and doctor degree.

Information about these distance education programs can be examined via the following interactive panels.

Panel 1 - State Category
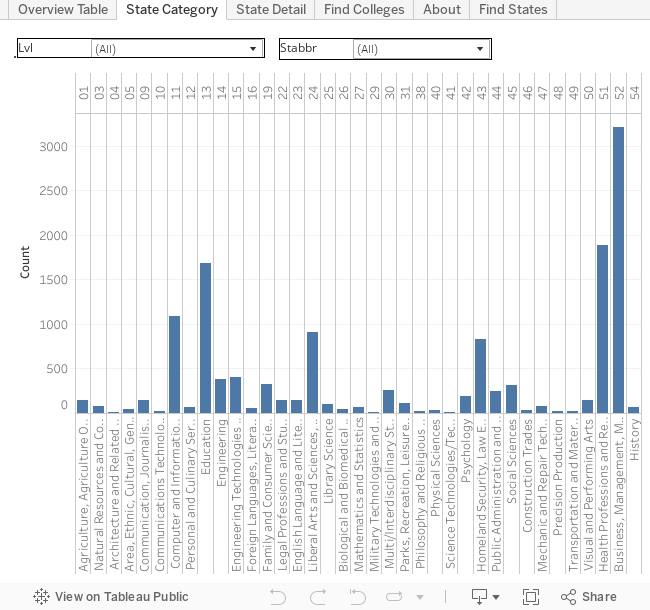
In panel 1, by selecting the state of interest and the degree level, user can exam the number of (distance education) programs offered in each discipline branch, depicted by the two-digit CIP (Classification of Instructional Program) code. By selecting all levels and all states, it can be observed that most programs are offered at the category of CIP 52, the Business, followed by CIP 51, the Health, and CIP 13, the Education branch. Summing over all states, at the Associate and Certificate level, the CIP 11, the Computer, ranked 3rd instead of CIP 13, the Education. At the bachelor level, CIP 24, the Libral Art, comes before CIP 13, and ranked as the 3rd. At the post bachelor and master level, CIP 13 is way ahead of Business (CIP 52) and Health (CIP 51), where they are of similar magnitude and traded each other with levels. For the doctor level, there are only 3 CIPs: 51, 13, and 44 (social services).

The state summary in Panel 1 is good if you are interested in in-state degrees. However, an online program being an online program is the freedom to enrolled from anywhere. In this case, searching from the program of interested maybe the way to go. Panel 2 shows exactly that.

Panel 2 - Find States
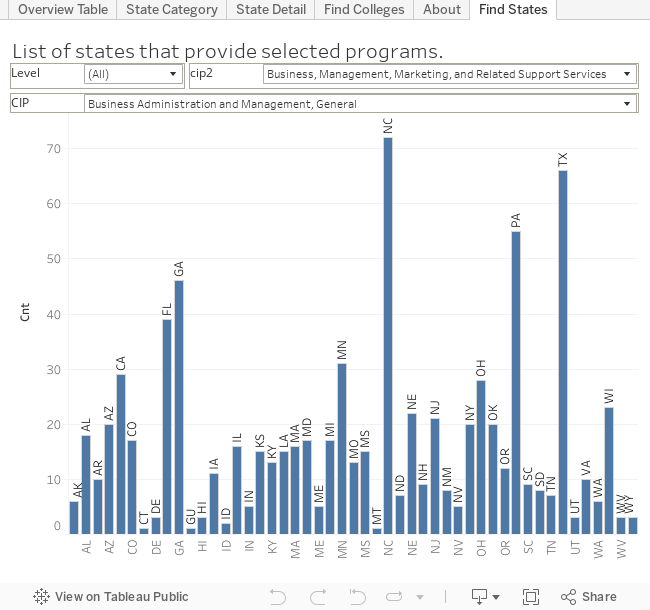
In Panel 2, reader can select the degree level:
    Assoicate and Certificates (DeCrtAssct)
    Bachelor (DeBchlr)
    Post Bachelor Certificates (DePstBchlr)
    Master (DeMstr)
    Post Master Certificates (DePstMstr)
    Doctor (DeDctr)
, the two-digit cip category, and, then, the cip program title. This allows reader to see from which states the selected programs are available. With this information, reader can continue to find out which college/institution offering the particular program.
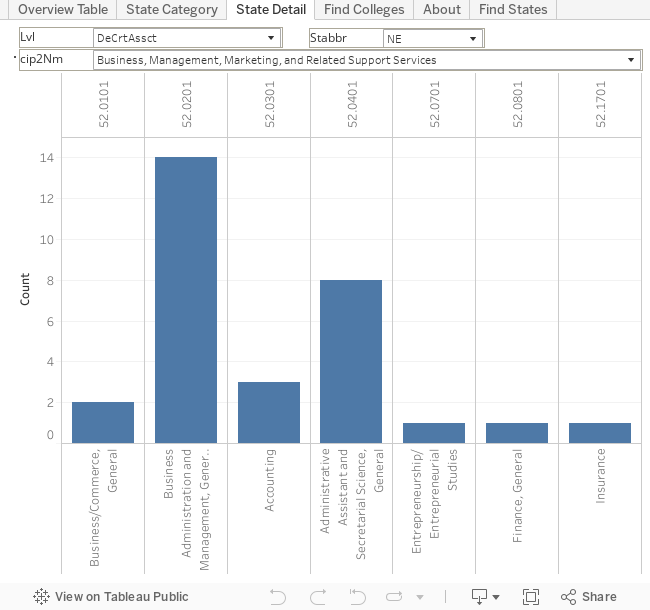
Panel 3 - State Detail

With this above panel, reader can find specific programs offered at the 6-digit CIP level - example are the Accounting training in the Business field (CIP 52).

Panel 4 - Find college
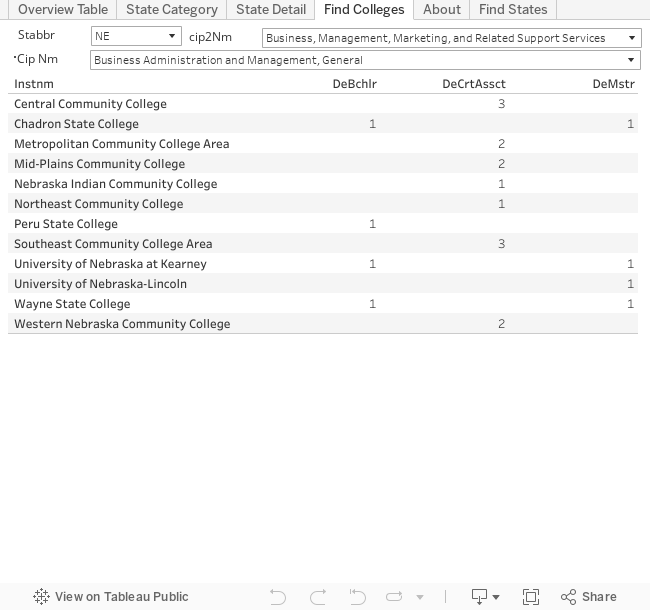
With Panel 4, reader can narrow their selection to the desired programs and the colleges that offered the programs.

Panel 5 - Overview Table
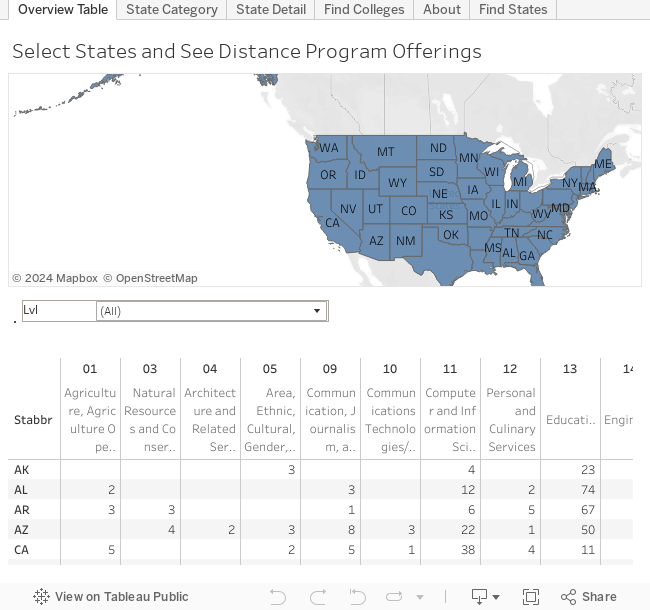
Panel 5 allows readers to compare program offered by each state. By selecting the desired states, readers can view program offerings side by side. For policy makers and higher education leaders, these data can be important in making decisions on what program to provide for the benefits of the society.

End

Wednesday, February 06, 2019

College Search, a tool and tutorial on using IPEDS college data

Begin
IPEDS (Integrated Postsecondary Education Data System) data is a vital data source for learning about colleges in the United States. As indicated in my previous articles, a good tool/program/application is very important in making a data usable.


In my previous article, I talked about how to use a program to monitoring the performance of peer institutions. In this article, I will go through the details of using the application to access IPEDS data and search for desired colleges/institutions. The process has many implications. For one, it can be used by high school graduates to search for college of interest. The same process can also be used by institution researchers in looking for potential peer institutions.

Information on the tool/program/application I used can be found at: IPEDS College Data UI and API project. The one interested for this article is: College Search - IPEDS data for High School Graduates + Researcher.


Before we begin, we need understand that when using any dataset, it is always important to have some basic knowledge about the industry/subject. For IPEDS, or, college/higher-education in the United States, these can include how institutions are classified and how these classification can change. For this article, what we need to understand is that institution can change - control, ownership included, and when searching them, it is important to look for them at a specific point in time, say, year. What you learn about an institution in one year, may or may not be hold for other years.

Back to the topic, the program we are going to look at has many uses. For this article, we will concentrate on just one tab/function - the institution tab. Under the institution tab, there are five sub-tabs that each provides well defined purposes to guide user to accomplish their goals.


The first sub-tab is the 'basic' sub-tab. The most important function for this tab is to establish the year of interest. User begin by searching the database for all years that are available and, then, select the year of interest. Once the year is selected, this tab also provide simple filter to limited the scope of search. Available options are detailed to assist user to make decisions.

After the basic categorical filter been applied, quantitative filtering can be applied by moving to the measures sub-tab. In this sub-tab, users can iteratively search and select the measures/quantities that are interested to them.

Once the measures of interest were selected, the Variable sub-tab is ready. In this tab,user get a chance to further qualify the measure/quantity they selected. For example, user maybe looking a the quantity of part-time enrolled male students while the qualifying 'factor' can be students levels, like undergraduate, or graduate students. By selecting applicable qualifying options and assign a name, a 'user-measure' is created ... like part-time-under-men, part-time-men-under-plus-graduate, ... etc.

With fully defined 'user-measures', user can now set the 'quantitative filters'. By moving to the Query sub-tab and typing in things like: part-time-under-men>1000 or
part-time-under-men/part-time-men-under-plus-graduate > 0.5, user can select institutions that met those criteria.

After the execution of the Query sub-tab, institutions found are appended to UnitId sub-tab. From there, you can retrieve the basic identity information of each selected institutions.

Once institutions were decided, user can use other major tabs to retrieve trend data about these institution and present these data in charts. For example: College Data Search - IPEDS tool for Peer Institutions Monitoring, the video and College Data Search, a tool - Monitoring Peer Institutions, the article.

As mentioned in the video, the process is very general. It can easily apply to any measures in the IPEDS database. The process also support the combination of measures and criteria. For example, user can even check if an institution's student minority ratio is higher than faculty's minority ratio.

End

Friday, February 01, 2019

College Data Search, an IPEDS tool - Monitoring Peer Institutions

Begin

IPEDS (Integrated Postsecondary Education Data System) data, without doubt, can be considered as the most important data source for United States' postsecondary education. However, even though IPEDS made efforts to make the data accessible to general public, barriers for using and analyzing those data are still high.

As described in my previous articles(IPEDS College Data - Distance Education Enrollment Trend, Higher Education IPEDS College Data UI and RESTful API - defnition, charting, demonstration) and youtube videos(IPEDS College Data UI and API project), at this moment, I am personally developing a data system that will make accessing to IPEDS data easier.

My most recent video that demonstrated the recent improved to my app/program can be found at the Youtube.com: College Data Search - IPEDS tool for Peer Institutions Monitoring


The video demonstrated how to use the app/program to monitor the status of a list of institutions over time. In our particular case, we use the peer institutions list of the Indiana University at Bloomington. The list can be obtained directly from Indiana University's web site: http://uirr.iu.edu/index.html

As is demonstrated by the video, Indiana University at Bloomington has the highest number of undergraduate degree-seeking enrollment headcount comparing to all its peers. On the other hand, the percent of students that took on-line classes ranked Indiana University the third from the last among its peers (year 2016).

One institution also stand out from the video. As shown in the video, the University of Texas at Arlington started out as an plausible peer of the Indiana University at Bloomington even though it did have the highest number of online students. Over the years, however, it is obvious that the University of Texas at Arlington has taken an initiative that grown its online community way faster than the rest of the institutions, including Indiana University at Bloomington.

The video also try to make few points on the peer institution selection. As pointed out, the most important thing in selecting peer institutions is look at the restrictions or constrains. In the case of the out-of-state online enrollment, one possible restriction would be the mission of the institution. For example, if the Indiana University at Bloomington was limited by either the public opinion or the legislature to focus its resources on in-state students while the University of Texas at Arlington is not. The two institutions, then, should not be considered peers even if they have the similar resources to operate.

With the improvement done to the app/program, an upcoming video will demonstrate a way to select institutions based on profiles - a process that helps selecting possible peer institutions. That same process can also be used by high school graduates looking for similar institutions that meet their college expectations.

Please visit my video and feel free to comment on it. For one, any indication of interest in the program will drive me to put more time into the project.

 End

Monday, November 12, 2018

Online Education Statistics (IPEDS Enrollment Trend)


If you are looking for online program offered by United States' public colleges, please use this online search tool/application to find colleges offering them.

With higher education continuing to be considered the footstep to reaching personal economic sufficiency, the demand for postsecondary education continues to grow. With the growing demands, governments, states, private companies, and institutions were working hard to capitalize and meet the demands. Distance education, with its nature, overcome several traditional higher education limitations.

Basic statistics of the distance education in United States were published in the 'Digest of Education Statistics' by National Center for Education Statistics (NCES). The most recent summary table published can be found here.

The table presents national level data with sector break down using the preliminary 2016 IPEDS (Integrated Postsecondary Education Data System) data published back in Feb. 2018. The table shows two years (2015 and 2016) of data, which are of limited use in showing the trends.

The purpose of this article is to fill the gaps and present some trend data using the 'data master' data system developed by the author. Information about the data system can be found at the ITTidbit, the Youtube, and the Vimeo.

For this article, I will be dealing with the National level data only as opposed to State level data, which will be dealt with in separate articles. The data presented here would be an enhancement to the basic statistics published by NCES in terms of the years of coverage, the break down of categories, and the revision of the data. The data used are revisions published by IPEDS as of Oct. 24, 2018.

The general observations of the data are:
  1. For degree-seeking students (include graduate students), which is the majority of undergraduates, the fraction of students taking online classes continue to grow.
  2. For 4-year schools, public and private not-for-profit schools, the number of students taking online classes are continue to grow.
  3. For 4-year degree seeking, private for-profit schools show high degree use of distance education - 65-80% vs. 15-30% for public and private not-for profit schools.

DC+50States of US; 4-year Inst.; Undergraduate Total; Any Online Course;

  Head Count : (4-year; Under)
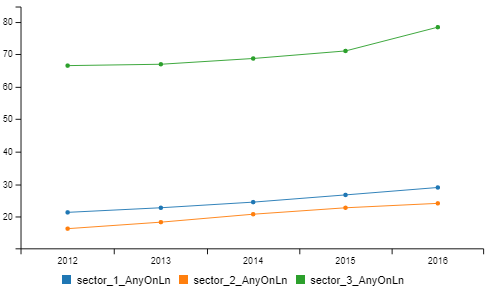
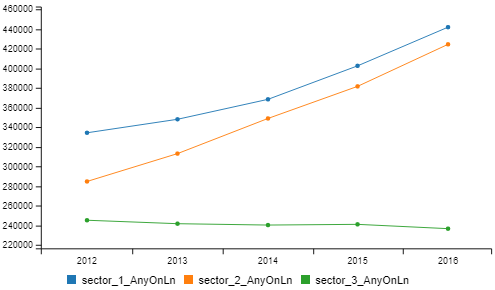
The chart above presents the enrollment headcount for undergraduate students that taking any online course in 4-year institutions located in the DC or the 50 states of United States. The blue line represents the public 4-year institutions while the orange line represents the private not-for-profit 4-year institutions. The green line represents the private for profit 4-year institutions.

  Percent of Undergraduate Enrollment : (4-year; Under)
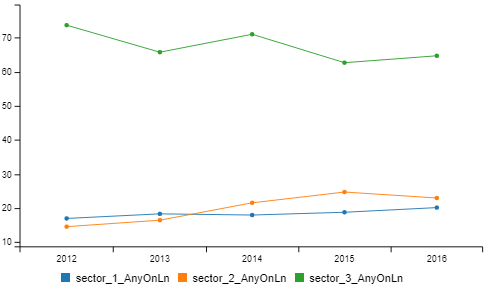
Head count is important, but it does not tell the whole story. Percent of total enrollment provides a different level of details. As shown in this above chart, the private for-profit institution (green line) actually utilized the distance education to higher degree while the public 4-year institution (blue line) comes next even though it has more students as shown in previous chart.

DC+50States of US; 4-year Inst.; Undergraduate Degree Seeking; Any Online Course;

  Head Count : (4-year; Under; Degree Seeking)

The chart above presents the enrollment headcount for undergraduate degree seeking students that taking any online course in 4-year institutions located in the DC or the 50 states of United States. The blue line represents the public 4-year institutions while the orange line represents the private not-for-profit 4-year institutions. The green line represents the private for profit 4-year institutions.

  Percent of Undergraduate Degree Seeking Student : (4-year)

DC+50States of US; 4-year Inst.; Undergraduate non-Degree Seeking; Any Online Course;

  Head Count : (4-year; Under; non-degree seeking)

  Percent of Undergraduate non-Degree Seeking students: (4-year)


DC+50States of US; 4-year Inst.; Graduate; Any Online Course;

  Head Count : (4-year; Graduate students)

The chart above presents the enrollment headcount for graduate students that taking any online course in 4-year institutions located in the DC or the 50 states of United States. The blue line represents the public 4-year institutions while the orange line represents the private not-for-profit 4-year institutions. The green line represents the private for profit 4-year institutions.

  Percent of Graduate enrollment : (4-year)


DC+50States of US; 2-year Inst.; enroll total; Any Online Course;

  Head Count : (2-year; enroll total)

The chart above presents the enrollment headcount for undergraduate students that taking any online course in 2-year institutions located in the DC or the 50 states of United States. The blue line represents the public 2-year institutions while the orange line represents the private not-for-profit 2-year institutions. The green line represents the private for profit 2-year institutions. One thing stand out in this chart is that the public 2-year institutions have much more students than that of private 2-year institutions.

   Percent of enrollment total : (2-year)


DC+50States of US; 2-year Inst.; degree seeking; Any Online Course;

  Head Count : (2-year; degree seeking)
Again, comparing with previous chart, it shows that majority undergraduate students are degree seeking students. For data concerning non-degree seeking students, please see the following section.

   Percent of degree seeking students : (2-year)
   
DC+50States of US; 2-year Inst.; non-degree seeking; Any Online Course;

  Head Count : (2-year; non-degree seeking)

   Percent of non-degree seeking students : (2-year)


=============

Data published by NCES Digest of Education Statistics:
  • Compare with private, public institution show less (%) distance students. Also less (%) exclusive distance students.
  • Compare with graduate, undergraduate show less (%) exclusive students but more none-exclusive students.
  • For profits shows much more exclusive students (4-year) - I assuming 2-year of smaller scale and not enthusiasm about distance ed.
  • 2 year, in general, more exclusive.
  • public has more in-state than out-of-state; private, the reverse is true. 
Data in general show the growing trend on distance/on-line education.
For public institution, because of the mission of educate state residents, public institution, in general, enrolls state residence and, therefore, less students from out of state and less students taking distance education courses from out of state.

It, however, can be a strategy move for public institution to accept out of state students if the capacity is allowed and to recover the cost of development.

It is also interested to see if it is possible to relate fields distribution to the number of students taking online courses since, likely, some fields are more suitable for online presentation.

From policy point of view, it may not be easy to make arguments with simple head count distribution since there are many factors in deciding what is an appropriate % of online courses.

Distance education, by definition, allow students to take courses away from the campus and, in that way, reduces spaces requirement. On the other hand, the requirement for staff's time may not reduced - staff will be transferred to work on tutorial duties. In a sense, you increase the quality in liue of reduce cost.

Serve the public - student body - the whole state.
How privates contributes.

Institution size - related to distance ed. - Serve each other institution.


 here

Wednesday, January 17, 2018

US College Graduation Rate by State - 2016 IPEDS

Original Article

Summary goes here!
Data Release.

Graduation Rate for Public 4-Year Institution
StatePELL GRLoan GROther GRAll GR
Alabama36.2%52.6%65.8%53.0%
Alaska17.0%20.7%28.4%24.0%
Arizona52.9%56.2%67.3%60.8%
Arkansas32.4%48.8%55.0%42.7%
California58.6%72.1%66.4%63.7%
Colorado39.6%51.7%57.5%51.0%
Connecticut56.0%56.3%69.4%63.6%
Delaware31.7%68.4%64.4%54.6%
District of Columbia8.2%0.0%20.8%12.7%
Florida40.7%53.8%57.2%49.0%
Georgia27.4%39.8%53.4%39.7%
Hawaii38.0%45.5%51.1%45.9%
Idaho34.5%45.4%47.2%40.7%
Illinois49.4%65.5%70.3%61.3%
Indiana40.0%56.3%60.2%52.1%
Iowa61.3%69.1%76.6%71.7%
Kansas40.8%54.4%62.9%54.6%
Kentucky36.7%45.9%60.0%48.5%
Louisiana37.6%41.6%56.4%48.1%
Maine38.3%50.4%58.4%47.3%
Maryland47.6%62.8%71.5%62.6%
Massachusetts56.3%66.1%61.4%61.2%
Michigan39.4%60.0%67.0%55.4%
Minnesota52.3%56.9%66.6%60.1%
Mississippi38.5%55.1%64.2%51.3%
Missouri40.9%55.6%65.5%55.3%
Montana39.1%46.5%49.5%44.5%
Nebraska48.6%53.8%63.7%57.2%
Nevada33.0%47.4%34.5%35.1%
New Hampshire62.2%69.9%72.4%68.8%
New Jersey61.0%71.5%73.2%68.5%
New Mexico36.1%35.4%47.5%40.8%
New York46.9%63.7%61.1%54.9%
North Carolina53.8%62.1%72.1%63.7%
North Dakota41.4%46.8%56.5%50.4%
Ohio33.3%56.6%66.3%51.0%
Oklahoma28.9%54.1%51.6%43.0%
Oregon50.4%61.0%63.5%59.0%
Pennsylvania51.1%64.2%70.9%62.6%
Rhode Island50.7%44.7%63.7%58.4%
South Carolina51.0%62.7%67.9%61.4%
South Dakota39.4%60.0%50.0%48.2%
Tennessee39.6%47.4%57.6%48.2%
Texas39.8%53.1%58.6%49.6%
Utah38.0%38.6%48.4%43.0%
Vermont51.9%62.7%71.6%63.2%
Virginia59.2%71.8%78.0%71.9%
Washington46.3%62.7%59.3%55.4%
West Virginia35.4%44.5%53.7%44.4%
Wisconsin43.7%54.6%60.7%54.3%
Wyoming44.9%44.5%60.9%55.4%

Public 2-Year Institution
StatePELL GRLoan GROther GRAll GR
Alabama11.7%18.3%38.6%20.8%
Alaska75.0%0.0%17.6%28.6%
Arizona15.4%17.2%21.4%17.9%
Arkansas23.9%19.3%34.4%26.6%
California26.5%28.8%35.4%31.1%
Colorado20.9%22.2%28.6%24.0%
Connecticut11.7%16.7%20.0%15.5%
Florida24.0%31.8%44.0%31.0%
Georgia24.8%26.8%29.9%26.2%
Hawaii15.4%16.9%19.5%17.4%
Idaho17.8%23.6%24.4%20.3%
Illinois21.2%28.4%32.9%27.1%
Indiana12.5%16.0%17.5%14.0%
Iowa26.4%35.3%34.5%30.6%
Kansas29.7%26.5%36.9%32.0%
Kentucky23.6%25.8%35.1%26.8%
Louisiana18.1%15.2%23.3%19.6%
Maine18.2%23.9%37.7%23.7%
Maryland13.4%16.1%22.9%18.5%
Massachusetts15.0%21.7%23.0%18.3%
Michigan13.1%17.6%19.2%15.6%
Minnesota24.2%32.4%33.4%28.3%
Mississippi25.3%30.3%43.6%30.5%
Missouri20.0%24.1%29.9%24.1%
Montana23.4%44.7%28.9%26.6%
Nebraska26.4%40.4%36.5%31.5%
Nevada32.4%37.5%28.5%30.6%
New Hampshire16.7%25.5%28.5%22.7%
New Jersey15.0%23.8%28.2%21.4%
New Mexico16.3%26.8%21.7%18.2%
New York21.4%27.0%29.1%24.3%
North Carolina16.1%28.5%27.3%20.7%
North Dakota35.3%44.2%50.6%43.6%
Ohio13.7%21.4%23.0%17.4%
Oklahoma18.3%20.9%27.8%22.6%
Oregon16.9%19.2%21.0%18.7%
Pennsylvania14.9%24.1%21.0%18.2%
Rhode Island13.7%0.0%18.5%16.5%
South Carolina12.1%14.2%19.9%14.8%
South Dakota47.7%66.2%68.7%57.6%
Tennessee15.5%17.3%28.0%19.4%
Texas16.2%17.3%16.6%16.4%
Utah16.6%28.9%25.3%20.6%
Vermont13.0%35.3%11.6%14.2%
Virginia22.0%24.1%32.2%26.5%
Washington31.2%35.9%38.3%34.8%
West Virginia17.9%17.1%30.8%20.3%
Wisconsin29.3%38.0%46.4%35.4%
Wyoming27.3%31.1%40.1%34.9%


Main body here

Thursday, August 22, 2013

Salaries for Professor, Instructor and Graduate Assistant - an IPEDS derivation


** If you are using Microsoft Internet Explorer or Google Chrom browser, you would not be able to read the formulas in this article. These formulas were written in MathML, a W3C standard, and can be viewed in FireFox.

For the 2012-13 IPEDS (Integrated Postsecondary Education Data System) data collection year, National Center for Education Statistics (NCES) changed the information it collected through its Human Resource component. This change in data collection dictates how the average salary for Full-Time instructional Faculty can be calculated.

This article intended to provide a comparison of the new and the old way of calculating the average salary. The discussion is intentionally simplified in order to demonstrate the conceptual differences.

Prior to 2012-13 data collection, headcount numbers and salary outlays were collected for faculty with 9- or 10-month contract and 11- or 12-month contract for each gender and rank. So, for each gender and rank, there are basically 4 numbers: Total Salary Outlay for faculty with 9- or 10-month contract (S9), Total Headcount for faculty with 9- or 10-month contract (H9), Total Salary Outlay for faculty with 11- or 12-month contract (S11), and Total Headcount for faculty with 11- or 12-month contract (H11). The suggested way (by NCES) to calculate the annual 9-month average salary for each gender-rank combination is given by:

  S9+ 911S11 H9+ H11

, which, in essence, is the average of the monthly salary times 9.

Beginning 2012-13 data collection year, for each gender-rank combination, 5 numbers are collected: the Total Headcount for faculty with 9-month contract (H9), the Total Headcount for faculty with 10-month contract (H10), the Total Headcount for faculty with 11-month contract (H11), the Total Headcount for faculty with 12-month contract (H12), and the Total Salary Outlay for faculty with all four contract length (S9+S10+S11+S12). The suggested way (by NCES) to calculate the annual 9-month average salary for each gender-rank combination is given by:

S9+S10+ S11+S12 9H9+ 10H10+ 11H11+ 12H12 x9

, which, in essence, is the total salary outlay distributed into the total number of manpower-month.

Logically, the methodology changes begged the explanation of the differences between these two methods.

For simplicity, case with only 9-month and 11-month faculties are considered. Under this condition, the 2012-13 method reduced to:

  S9+ S11 9H9+ 11H11x9 .

By carrying out the difference of the new and old methods, we arrived at:

211S11 - 29x ( S9+ 911S11 H9+ H11 ) xH11 9H9+ 11H11 x 9.

The difference indicates if the new number is higher or lower than the old number and by how much. The value represented by the parenthesis is that of the old method - the average monthly salary times 9 month. By multiplying it by two over nine and times the number of faculty with 11-month contract, the result represents the amount of money needed to bring the 11-month faculties' average salary to that of the old method for the two months (9-11). The leading term in the numerator indicates the two month allocation from the total salary outlay for the 11-month faculties. The net value of the numerator is, therefore, the amount of money that can be used the raise or lower the value of the new method apart from the average monthly salary of the old method. By solving the inequality equation:

211S11 - 29x ( S9+ 911S11 H9+ H11 ) xH11 >0
 
, it can be proofed that higher monthly salary for the 11-month faculties would result in higher value for the 2012-13 formula than the older formula and the reverse is also true.

By consideration above and by making the same assumption NCES had made in the past (i.e. assuming all faculty with 9- or 10-month contracts are actually 9-month contract and that all faculty with 11- or 12-month contract are actually 11-month contract), it is possible to apply the new method to the pre 2012-13 data with predictable discrepancy.

Even though NCES had used the 9- and 11-month assumption in the past, the new 2012-13 data can be used to gauge if that assumption is a valid one. For example, the 2012-13 data revealed that majority of Nebraska's colleges are either have 9-month contracts or 12-month contracts. There are some 10-month contracts, but the 11-month contracts are nearly none. With these observation, the following formulas is a better estimate for the pre 2012-13 data:
S9+ 912S12 H9+ H12  

At the same time, by discounting the minorities, the following formula can be applied to all years:
S9+ S12 9H9+ 12H12x9

This would show the effects and differences caused by the new formula and also provide a ( reasonably ) compatible trend from the past to current.

Wednesday, May 30, 2012

It’s time to drop the college-for-all crusade

Original Article

Summary goes here!

Personally, I would attribute some of these kind of  bad American policies to the generosity of American and some to the idea of 'Political Correctness'.

As a foreign born American, I am totally impressed by the generosity of American and, at times, puzzled and resisted. Growing up, I took nothing for granted even though I have supporting parents. I was educated, taught and self-studied, that begging is of no dignity and god only help people that help themselves. Personally, I have been summon all these under the 'responsibility'.

As to the 'Political Correctness', for one thing, I would like to remind the reader that OPPORTUNITIES is all it should be considered. Given the opportunity, in the sense of promote responsibility, it is up to the people to work hard to get what they want.

More practically, we should realized that not all people were born equal, intellectually. The best a society can hopeful is to have everyone do their best. To have people reach their best is to teach them being responsible. To teach responsibility, the operation of the system and the society must, by itself, promote responsibility. For example, to entitle to education as a right, students must demonstrate their wiliness to put in efforts in studying. For a normal people, this can simply be a requirement to reach certain testing scores. This is nothing new, what is new is the infusion of the idea of responsibility.

In theory, I am willing to support the idea of free education for all those who did their best. On the other hand, since resources are limited, we should support those who will benefit the society the most. With the full support of the society, I am visioning the building of a system where the freely educated scholars recognizing the support from and the responsibility to the society. Formula may need be sought to build a practical system, the idea is to promote responsibility as the core value of education.

For people reaching their best but were not able to be the best, this is where the society come in to benefit the constituent of the whole society.

Sunday, October 03, 2010

Job outlook for college graduates - the supply and demand in Nebraska

Interact with the author through EduStats - We value your input.
CL Higher Education Center

CL Higher Education Center has just released the data behind the 'workforce supply/demand higher education - Nebraska' report. The methodology is discussed in 'college workforce supply/demand - methodology'.

The released Excel workbook contains few worksheets. One for the oversupply academic programs and one for the under supply academic programs. Besides these two worksheets, there are worksheets that help reader look into how the oversupply and under-supply lists are derived.

In the case of oversupply academic programs, let's look at the academic program: 130301 - Curriculum and Instruction - Master Degree. If we look at the XWalk_ByCIP worksheet, we found that the only appropriate occupation for this CIP is the Instructional Coordinators. That occupation has an annual job opening of 37 while Nebraska colleges produced 523 graduates in the academic year of 2008-09.

An example for the under-supply academic program should provide enough exercises for reader to understand the result better. Look under the XWalk_ByCIP worksheet for the CIP of 521001, it is clear that seven occupations are appropriate for graduates from this CIP. The seven occupations provide a total of 340 job openings a year. By looking under the RvlCIP worksheet for this CIP, we notice that three of the seven occupations can also accept graduates from two other CIPs: 521005 and 521003. These 2 CIPs produce a total 5 graduates in the 2008-09 academic year. The net result is that there can have at least 335 job opening for our focus CIP of 521001. Since during the 2008-09 academic year, there were 226 Nebraska college graduates that are from this CIP, the net results is that there will be at least 109 jobs remain unfilled.

An interesting question to ask is what's the economic implication of all these?

Thursday, September 30, 2010

college workforce supply/demand - methodology

Interact with the author through EduStats - We value your input.

In conclusion, we have proofed that the methodology we used does allow us to identify both the definitely over supply and under supply academic programs. To put this in plain English, it means that if we labeled an academic program over supply, the program is definitely over supply - no matter how you simulate the hiring based on the crosswalks. The same is true for the under supply academic programs. Our designation, however, does not suggest to the policy maker to increase the number of graduates of all under supply academic programs to the amount of shortages since some of the programs are related.

This article is a technical note that described the research methodology employed in the analysis of my previous article titled 'workforce supply/demand higher education - Nebraska'.

Updated June 8, 2015: An improved approach provides better directions for program management agency or policy maker.

The whole idea behind the analysis is what we called the worst case scenario analysis, which is commonly used in simplify a complicate problem so that some guidance for further analysis can be devised. A common result of such analysis is the lower bound or upper bound of a variable of interest.

The problem of the supply and demand interaction between higher education and workforce is a complex one. It is not mathematically challenge but nevertheless a complex one. The goal is aimed to understand how college/higher education graduates are fed into the workforce.

The ground work to the problem was laid years ago. Researcher and workforce development workers, after years of study, have documented the field and the level of knowledge needed for each occupation. In the same time, crosswalk tables were created that linked each academic program to the related occupation. In the crosswalk framework, the occupation is classified by the so called 'Standard Occupational Code' (SOC) and the academic program is classified by the 'Classification of Instructional Program' (CIP) code and the degree level awarded.

The complexity of the problem rooted at the fact that the crosswalks between the academic program and the occupation is not a single one to one map. As we can all image that graduates from one academic program can be fed into more than one occupation. The reverse of that is alos true: An occupation can accept graduates from more than one academic programs. It is this complexity that have limited most analysis to a smaller scale. For example, a Texas supply and demand study only focused on few big categories and the 'The Occupational Supply Demand System' website only provides tools for navigating between academic programs and occupations.

An additional complexity is also exist that the education classification system used to classify the occupation is not directly compatible with that used to classify the academic program either. For our study, since we are only interested in college educated graduates, all jobs classified with less than college degree requirement are discarded based on the idea that, for most cases, it wouldn't worth the investment for a college graduates to take that kind of jobs. In order to address the incompatibility between the two education classification system, a new education classification is improvised which allows the creation of a one to one map, in the mathematical sense, from both the academic and the occupational system to the new classification. The mapping is outlined below:

AcademicOursOccupational


Less Than 1 Year AwardsLess than 2 year certificatesPostsecondary vocational training
Between 1 and 2 Years AwardsLess than 2 year certificatesPostsecondary vocational training
Associates DegreesAssociate (+Less than 4 year)Associate degree
Between 2 and 4 Years AwardsAssociate (+Less than 4 year)Associate degree
Bachelors DegreesBachelor (+Certificates)Bachelor's or higher degree, plus work experience
Bachelors DegreesBachelor (+Certificates)Bachelor's degree
Post-Bachelors CertificatesBachelor (+Certificates)Bachelor's degree
Post-Bachelors CertificatesBachelor (+Certificates)Bachelor's or higher degree, plus work experience
Masters DegreesMaster (+Certificates)Master's degree
Post-Masters CertificatesMaster (+Certificates)Master's degree
Doctorate DegreesDoctorDoctoral degree
First Professional DegreesFirst Professional (+Certificates)First professional degree
Post-First Professional CertificatesFirst Professional (+Certificates)First professional degree
Doctor's degree - research/scholarshipDoctorDoctoral degree
Doctor's degree - professional practiceFirst Professional (+Certificates)First professional degree
Doctor's degree - OtherDoctorDoctoral degree


In theory, with enough computing power, we can simulate all possible scenarios and draw conclusions from the all possible assumptions. However, that kind of approach could easily bury the intuitive common sense and lost the researcher in the forest of data.

Since our goal is to identify the definitely over-supply and the definitely under-supply academic programs, we chose to use the worse case scenario analysis.

Since the process of establishing the lower bound for over-supply is much straightforward, we will describe it first.

By definition, an academic program is over-supply if there are fewer jobs appropriate for the program than the number of graduates from that academic program. By assuming that all appropriate jobs openings for an academic program are available to graduates from that academic program, we can calculate the number of graduates that could not find a job opening by subtracting the number of job openings from the number of graduates. If the result of the calculation is a postive number, we know the number of graduates would not be able to find the appropriate jobs. In reality, some of the appropriate job openings could be filled with graduates from other academic program and, hence, reduce the number of openings available to our focus academic program. However, the program we identified as over supply will still be over supplying its graduates, just to a bigger amount. The result we arrived is, therefore, a lower bound and the academic program we identified is, therefore, a definitely over supply program.

The process of producing the lower bound for the under-supply academic program is a bit more complicated. The idea begins with that if an academic program produced fewer graduates than what the industry can absorb, then that academic program is a under-supply program. The number of shortage in supply or the number of job openings to fill can be calculated by subtracting the number of graduates from the number of those job openings. As a first attempt, we could proceed the calculation using job openings from all appropriate occupations for a given academic program. However, in reality, some of the appropriate job openings could be filled with graduates from other academic programs. The number we arrived previous is, therefore, an over estimate of the shortage problem. The shortage may not even exist if all those appropriate jobs can be filled with graduates from other academic programs.

To resolve this problem, we begin our first step by identifying all the rival academic programs of our focus academic program. By definition, the rival academic programs are programs that could supply graduates to any of the appropriate job opening of our focus academic program. Once we identified all the rival academic program, we can calculated the total rival graduates by adding all the graduates from these rival academic programs. We, now, recalculate the shortage or the number of job opening to fill by subtracting both the number of graduates of our focus program and the rival graduates from the appropriate job openings of our focus program.In reality, not all rival graduates can fill those appropriate job openings. In that case, the number of job openings to be filled will be larger. The result we arrived is, therefore, an absolute minimum of the number of job openings need to be filled. We, therefore, termed that academic program a definitely under-supply program.

In conclusion, we have proofed that the methodology we used does allow us to identify both the definitely over supply and under supply academic programs. To put this in plain English, it means that if we labeled an academic program over supply, the program is definitely over supply - no matter how you simulate the hiring based on the crosswalks. The same is true for the under supply academic programs. Our designation, however, does not suggest to the policy maker to increase the number of graduates of all under supply academic programs to the amount of shortages since some of the programs are related. Increase the graduates in one academic program may reduce the number of job openings of a rival academic program and move that program off the under supply list.