Begin
IPEDS (Integrated Postsecondary Education Data System) data is a vital data source for learning about colleges in the United States. As indicated in my previous articles, a good tool/program/application is very important in making a data usable.
In my previous article, I talked about how to use a program to monitoring the performance of peer institutions. In this article, I will go through the details of using the application to access IPEDS data and search for desired colleges/institutions. The process has many implications. For one, it can be used by high school graduates to search for college of interest. The same process can also be used by institution researchers in looking for potential peer institutions.
Information on the tool/program/application I used can be found at: IPEDS College Data UI and API project. The one interested for this article is: College Search - IPEDS data for High School Graduates + Researcher.
Before we begin, we need understand that when using any
dataset, it is always important to have some basic knowledge about the
industry/subject. For IPEDS, or, college/higher-education in the United
States, these can include how institutions are classified and how these
classification can change. For this article, what we need to understand
is that institution can change - control, ownership included, and when
searching them, it is important to look for them at a specific point in
time, say, year. What you learn about an institution in one year, may or
may not be hold for other years.
Back to the topic, the program we are going to look at has many uses. For this article, we will concentrate on just one tab/function - the institution tab. Under the institution tab, there are five sub-tabs that each provides well defined purposes to guide user to accomplish their goals.
The first sub-tab is the 'basic' sub-tab. The most important function for this tab is to establish the year of interest. User begin by searching the database for all years that are available and, then, select the year of interest. Once the year is selected, this tab also provide simple filter to limited the scope of search. Available options are detailed to assist user to make decisions.
After the basic categorical filter been applied, quantitative filtering can be applied by moving to the measures sub-tab. In this sub-tab, users can iteratively search and select the measures/quantities that are interested to them.
Once the measures of interest were selected, the Variable sub-tab is ready. In this tab,user get a chance to further qualify the measure/quantity they selected. For example, user maybe looking a the quantity of part-time enrolled male students while the qualifying 'factor' can be students levels, like undergraduate, or graduate students. By selecting applicable qualifying options and assign a name, a 'user-measure' is created ... like part-time-under-men, part-time-men-under-plus-graduate, ... etc.
With fully defined 'user-measures', user can now set the 'quantitative filters'. By moving to the Query sub-tab and typing in things like: part-time-under-men>1000 or
part-time-under-men/part-time-men-under-plus-graduate > 0.5, user can select institutions that met those criteria.
After the execution of the Query sub-tab, institutions found are appended to UnitId sub-tab. From there, you can retrieve the basic identity information of each selected institutions.
Once institutions were decided, user can use other major tabs to retrieve trend data about these institution and present these data in charts. For example: College Data Search - IPEDS tool for Peer Institutions Monitoring, the video and College Data Search, a tool - Monitoring Peer Institutions, the article.
As mentioned in the video, the process is very general. It can easily apply to any measures in the IPEDS database. The process also support the combination of measures and criteria. For example, user can even check if an institution's student minority ratio is higher than faculty's minority ratio.
End
Wednesday, February 06, 2019
College Search, a tool and tutorial on using IPEDS college data
Friday, February 01, 2019
College Data Search, an IPEDS tool - Monitoring Peer Institutions
Begin
IPEDS (Integrated Postsecondary Education Data System) data, without doubt, can be considered as the most important data source for United States' postsecondary education. However, even though IPEDS made efforts to make the data accessible to general public, barriers for using and analyzing those data are still high.
As described in my previous articles(IPEDS College Data - Distance Education Enrollment Trend, Higher Education IPEDS College Data UI and RESTful API - defnition, charting, demonstration) and youtube videos(IPEDS College Data UI and API project), at this moment, I am personally developing a data system that will make accessing to IPEDS data easier.
My most recent video that demonstrated the recent improved to my app/program can be found at the Youtube.com: College Data Search - IPEDS tool for Peer Institutions Monitoring
The video demonstrated how to use the app/program to monitor the status of a list of institutions over time. In our particular case, we use the peer institutions list of the Indiana University at Bloomington. The list can be obtained directly from Indiana University's web site: http://uirr.iu.edu/index.html
As is demonstrated by the video, Indiana University at Bloomington has the highest number of undergraduate degree-seeking enrollment headcount comparing to all its peers. On the other hand, the percent of students that took on-line classes ranked Indiana University the third from the last among its peers (year 2016).
One institution also stand out from the video. As shown in the video, the University of Texas at Arlington started out as an plausible peer of the Indiana University at Bloomington even though it did have the highest number of online students. Over the years, however, it is obvious that the University of Texas at Arlington has taken an initiative that grown its online community way faster than the rest of the institutions, including Indiana University at Bloomington.
The video also try to make few points on the peer institution selection. As pointed out, the most important thing in selecting peer institutions is look at the restrictions or constrains. In the case of the out-of-state online enrollment, one possible restriction would be the mission of the institution. For example, if the Indiana University at Bloomington was limited by either the public opinion or the legislature to focus its resources on in-state students while the University of Texas at Arlington is not. The two institutions, then, should not be considered peers even if they have the similar resources to operate.
With the improvement done to the app/program, an upcoming video will demonstrate a way to select institutions based on profiles - a process that helps selecting possible peer institutions. That same process can also be used by high school graduates looking for similar institutions that meet their college expectations.
Please visit my video and feel free to comment on it. For one, any indication of interest in the program will drive me to put more time into the project.
End
Monday, November 12, 2018
Online Education Statistics (IPEDS Enrollment Trend)
If you are looking for online program offered by United States' public colleges, please use this online search tool/application to find colleges offering them.
With higher education continuing to be considered the footstep to reaching personal economic sufficiency, the demand for postsecondary education continues to grow. With the growing demands, governments, states, private companies, and institutions were working hard to capitalize and meet the demands. Distance education, with its nature, overcome several traditional higher education limitations.Basic statistics of the distance education in United States were published in the 'Digest of Education Statistics' by National Center for Education Statistics (NCES). The most recent summary table published can be found here.
The table presents national level data with sector break down using the preliminary 2016 IPEDS (Integrated Postsecondary Education Data System) data published back in Feb. 2018. The table shows two years (2015 and 2016) of data, which are of limited use in showing the trends.
The purpose of this article is to fill the gaps and present some trend data using the 'data master' data system developed by the author. Information about the data system can be found at the ITTidbit, the Youtube, and the Vimeo.
For this article, I will be dealing with the National level data only as opposed to State level data, which will be dealt with in separate articles. The data presented here would be an enhancement to the basic statistics published by NCES in terms of the years of coverage, the break down of categories, and the revision of the data. The data used are revisions published by IPEDS as of Oct. 24, 2018.
The general observations of the data are:
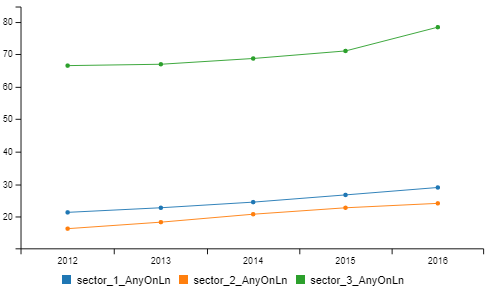
- For degree-seeking students (include graduate students), which is the majority of undergraduates, the fraction of students taking online classes continue to grow.
- For 4-year schools, public and private not-for-profit schools, the number of students taking online classes are continue to grow.
- For 4-year degree seeking, private for-profit schools show high degree use of distance education - 65-80% vs. 15-30% for public and private not-for profit schools.
DC+50States of US; 4-year Inst.; Undergraduate Total; Any Online Course;
Head Count : (4-year; Under)

Percent of Undergraduate Enrollment : (4-year; Under)
DC+50States of US; 4-year Inst.; Undergraduate Degree Seeking; Any Online Course;
Head Count : (4-year; Under; Degree Seeking)

Percent of Undergraduate Degree Seeking Student : (4-year)

DC+50States of US; 4-year Inst.; Undergraduate non-Degree Seeking; Any Online Course;
Head Count : (4-year; Under; non-degree seeking)

Percent of Undergraduate non-Degree Seeking students: (4-year)
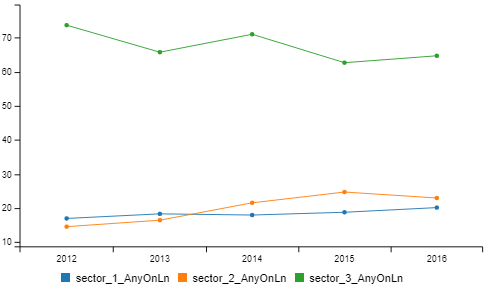
DC+50States of US; 4-year Inst.; Graduate; Any Online Course;
Head Count : (4-year; Graduate students)
The chart above presents the enrollment headcount for graduate students that taking any online course in 4-year institutions located in the DC or the 50 states of United States. The blue line represents the public 4-year institutions while the orange line represents the private not-for-profit 4-year institutions. The green line represents the private for profit 4-year institutions.
Percent of Graduate enrollment : (4-year)

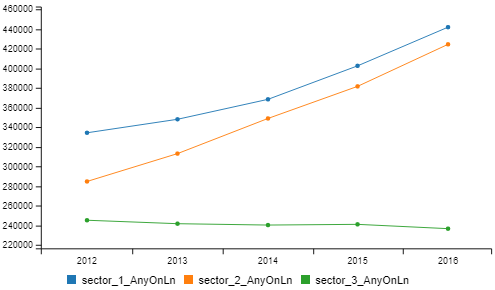
DC+50States of US; 2-year Inst.; enroll total; Any Online Course;
Head Count : (2-year; enroll total)

The chart above presents the enrollment headcount for undergraduate students that taking any online course in 2-year institutions located in the DC or the 50 states of United States. The blue line represents the public 2-year institutions while the orange line represents the private not-for-profit 2-year institutions. The green line represents the private for profit 2-year institutions. One thing stand out in this chart is that the public 2-year institutions have much more students than that of private 2-year institutions.
Percent of enrollment total : (2-year)

DC+50States of US; 2-year Inst.; degree seeking; Any Online Course;
Head Count : (2-year; degree seeking)

Percent of degree seeking students : (2-year)

DC+50States of US; 2-year Inst.; non-degree seeking; Any Online Course;
Head Count : (2-year; non-degree seeking)

Percent of non-degree seeking students : (2-year)

=============
Data published by NCES Digest of Education Statistics:
- Compare with private, public institution show less (%) distance students. Also less (%) exclusive distance students.
- Compare with graduate, undergraduate show less (%) exclusive students but more none-exclusive students.
- For profits shows much more exclusive students (4-year) - I assuming 2-year of smaller scale and not enthusiasm about distance ed.
- 2 year, in general, more exclusive.
- public has more in-state than out-of-state; private, the reverse is true.
For public institution, because of the mission of educate state residents, public institution, in general, enrolls state residence and, therefore, less students from out of state and less students taking distance education courses from out of state.
It, however, can be a strategy move for public institution to accept out of state students if the capacity is allowed and to recover the cost of development.
It is also interested to see if it is possible to relate fields distribution to the number of students taking online courses since, likely, some fields are more suitable for online presentation.
From policy point of view, it may not be easy to make arguments with simple head count distribution since there are many factors in deciding what is an appropriate % of online courses.
Distance education, by definition, allow students to take courses away from the campus and, in that way, reduces spaces requirement. On the other hand, the requirement for staff's time may not reduced - staff will be transferred to work on tutorial duties. In a sense, you increase the quality in liue of reduce cost.
Serve the public - student body - the whole state.
How privates contributes.
Institution size - related to distance ed. - Serve each other institution.
here
Friday, February 02, 2018
Educational Attainment and State Income - ACS PUMS
Educational Attainment is a measure that often used to gauge the intellectual power of a region. As a nation, it was concerned that the United State could fall behind in global economic competition and this caused various movement and initiatives try to increase the number of college graduates in the United States. While working on other projects, the author suspects the linkage between educational attainment and a state's income. This is the author's first attempt in linking a state's per capita income to the educational attainment of the state.
This article using the American Community Survey's PUMS data released by US Census Bureau to compare the educational attainment of each state. The advantage of the PUMS data is its ability to produce statistic results that is not directly available from pre-prepared tables offered by Census' website. In our case, we are interested in the educational attainment of adult population with age between 22 and 64 years old in each state.
For ranking, we will rank states with several educational attainment configurations. See the following tables for detail.
As to the relation between per capita income and educational attainment, I will just show three quick charts at this point - it deserves closer analysis later.
* The per capita income data obtained from List of U.S. states by income on Feb. 2, 2018. The income data is derived from 2014-10 ACS data. * In general, per capita income concerns people of age 15 or older which isn't really match the age range we used in calculating the educational attainment. But assuming that the income contributed from age 15 to 22 are limited and that the adding of age 65 to 99 do change the fact much (say, the retirement income of graduate degree holder still higher than that of bachelor degree holder), the result could still be representative. A finer investigation of the situation will follow.
 |
| For Bachelor-and-above degree holder |
 |
| For Graduate degree holder |
 |
| For Doctor and Professional degree holder |
* Correlation is also done for associate degree and above and it shows lower correlation values than that of bachelor and above with or without District of Columbia.
==========
Ranking states by percent of bachelor-and-above degree holder
| Stt Nm | 2010 Rank | 2011 Rank | 2015 Rank | 2016 Rank | 2010 % | 2011 % | 2015 % | 2016 % |
|---|---|---|---|---|---|---|---|---|
| District of Columbia | 1 | 1 | 1 | 1 | 52.5% | 53.2% | 57.4% | 58.3% |
| Massachusetts | 2 | 2 | 2 | 2 | 41.6% | 41.7% | 43.0% | 43.7% |
| Connecticut | 3 | 3 | 3 | 3 | 37.5% | 37.8% | 39.3% | 39.8% |
| New Jersey | 4 | 4 | 4 | 4 | 37.3% | 37.4% | 38.9% | 39.5% |
| Maryland | 5 | 5 | 5 | 5 | 37.2% | 37.3% | 38.7% | 39.0% |
| Colorado | 6 | 6 | 6 | 6 | 36.5% | 36.7% | 37.9% | 38.3% |
| Virginia | 7 | 7 | 7 | 7 | 35.4% | 35.7% | 37.4% | 37.9% |
| Vermont | 8 | 8 | 8 | 10 | 34.8% | 35.5% | 36.6% | 36.1% |
| New York | 9 | 10 | 9 | 8 | 34.5% | 34.8% | 36.2% | 36.6% |
| New Hampshire | 10 | 9 | 10 | 9 | 34.5% | 34.8% | 36.1% | 36.6% |
| Minnesota | 11 | 11 | 11 | 11 | 33.5% | 33.7% | 35.4% | 35.6% |
| Rhode Island | 12 | 12 | 13 | 13 | 32.6% | 32.9% | 33.2% | 33.8% |
| Illinois | 13 | 13 | 12 | 12 | 32.6% | 32.8% | 34.2% | 34.7% |
| Washington | 14 | 14 | 14 | 14 | 31.2% | 31.3% | 32.6% | 33.3% |
| Kansas | 15 | 15 | 15 | 16 | 31.1% | 31.2% | 31.9% | 32.3% |
| North Dakota | 16 | 18 | 22 | 22 | 30.3% | 29.7% | 29.9% | 30.3% |
| California | 17 | 16 | 18 | 19 | 30.1% | 30.1% | 31.0% | 31.5% |
| Hawaii | 18 | 17 | 19 | 18 | 30.1% | 29.9% | 30.9% | 31.5% |
| Nebraska | 19 | 19 | 16 | 15 | 29.8% | 29.7% | 31.7% | 32.4% |
| Oregon | 20 | 20 | 21 | 21 | 29.3% | 29.4% | 30.4% | 31.1% |
| Pennsylvania | 21 | 21 | 17 | 17 | 29.3% | 29.4% | 31.0% | 31.7% |
| Delaware | 22 | 23 | 20 | 20 | 28.9% | 28.5% | 30.8% | 31.4% |
| Montana | 23 | 22 | 28 | 29 | 28.8% | 29.2% | 28.7% | 28.9% |
| Utah | 24 | 24 | 23 | 24 | 28.7% | 28.4% | 29.5% | 29.9% |
| Georgia | 25 | 25 | 26 | 27 | 28.0% | 28.2% | 29.1% | 29.6% |
| Wisconsin | 26 | 27 | 25 | 23 | 27.6% | 27.6% | 29.3% | 29.9% |
| Maine | 27 | 26 | 24 | 26 | 27.6% | 28.0% | 29.5% | 29.7% |
| Iowa | 28 | 28 | 29 | 28 | 27.4% | 27.4% | 28.7% | 29.2% |
| North Carolina | 29 | 29 | 27 | 25 | 27.3% | 27.4% | 29.1% | 29.8% |
| South Dakota | 30 | 31 | 32 | 31 | 27.2% | 27.3% | 27.7% | 28.5% |
| Missouri | 31 | 30 | 30 | 30 | 27.0% | 27.3% | 28.5% | 28.8% |
| Michigan | 32 | 32 | 31 | 32 | 26.7% | 26.7% | 27.9% | 28.3% |
| Florida | 33 | 33 | 35 | 35 | 26.6% | 26.4% | 27.3% | 27.7% |
| Alaska | 34 | 34 | 36 | 36 | 26.4% | 26.2% | 27.0% | 27.5% |
| Arizona | 35 | 37 | 37 | 37 | 26.1% | 25.8% | 26.7% | 27.1% |
| Texas | 36 | 36 | 34 | 34 | 26.0% | 26.2% | 27.4% | 27.9% |
| Ohio | 37 | 35 | 33 | 33 | 26.0% | 26.2% | 27.4% | 28.0% |
| South Carolina | 38 | 39 | 39 | 38 | 24.8% | 24.7% | 25.8% | 26.6% |
| New Mexico | 39 | 40 | 43 | 43 | 24.7% | 24.4% | 24.6% | 24.8% |
| Idaho | 40 | 38 | 41 | 42 | 24.7% | 25.0% | 25.3% | 25.5% |
| Indiana | 41 | 41 | 42 | 41 | 24.1% | 24.2% | 25.3% | 25.9% |
| Tennessee | 42 | 43 | 38 | 39 | 24.0% | 24.1% | 26.0% | 26.5% |
| Wyoming | 43 | 42 | 40 | 40 | 23.6% | 24.2% | 25.7% | 25.9% |
| Oklahoma | 44 | 44 | 44 | 44 | 23.3% | 23.4% | 24.5% | 24.7% |
| Alabama | 45 | 45 | 45 | 45 | 22.9% | 22.9% | 23.9% | 24.4% |
| Kentucky | 46 | 46 | 46 | 46 | 21.8% | 21.7% | 23.2% | 23.7% |
| Nevada | 47 | 47 | 48 | 48 | 21.6% | 21.6% | 22.0% | 22.2% |
| Louisiana | 48 | 48 | 47 | 47 | 21.5% | 21.6% | 22.8% | 23.2% |
| Mississippi | 49 | 50 | 50 | 51 | 20.1% | 20.1% | 20.6% | 20.8% |
| Arkansas | 50 | 49 | 49 | 49 | 20.1% | 20.4% | 21.8% | 22.1% |
| West Virginia | 51 | 51 | 51 | 50 | 18.8% | 19.2% | 20.5% | 20.9% |
Ranking states by percent of graduate degree holder
| Stt Nm | 2010 Rank | 2011 Rank | 2015 Rank | 2016 Rank | 2010 % | 2011 % | 2015 % | 2016 % |
|---|---|---|---|---|---|---|---|---|
| District of Columbia | 1 | 1 | 1 | 1 | 26.5% | 26.7% | 29.8% | 30.6% |
| Massachusetts | 2 | 2 | 2 | 2 | 16.4% | 16.5% | 17.3% | 17.6% |
| Maryland | 3 | 3 | 3 | 3 | 15.6% | 15.6% | 16.4% | 16.6% |
| Connecticut | 4 | 4 | 4 | 4 | 15.2% | 15.4% | 16.0% | 16.2% |
| Virginia | 5 | 5 | 5 | 5 | 13.7% | 13.8% | 14.8% | 15.1% |
| New York | 6 | 6 | 6 | 6 | 13.7% | 13.8% | 14.3% | 14.4% |
| New Jersey | 7 | 7 | 7 | 7 | 13.2% | 13.2% | 13.7% | 14.0% |
| Vermont | 8 | 8 | 9 | 9 | 12.3% | 12.5% | 12.7% | 12.8% |
| Colorado | 9 | 9 | 8 | 8 | 12.0% | 12.1% | 12.7% | 13.0% |
| Rhode Island | 10 | 11 | 12 | 12 | 11.7% | 11.8% | 12.0% | 12.2% |
| New Hampshire | 11 | 10 | 10 | 10 | 11.6% | 11.9% | 12.6% | 12.6% |
| Illinois | 12 | 12 | 11 | 11 | 11.4% | 11.4% | 12.1% | 12.3% |
| Delaware | 13 | 13 | 13 | 13 | 10.9% | 10.7% | 11.4% | 11.6% |
| Washington | 14 | 14 | 15 | 15 | 10.4% | 10.5% | 11.0% | 11.2% |
| Pennsylvania | 15 | 15 | 14 | 14 | 10.3% | 10.4% | 11.1% | 11.3% |
| California | 16 | 16 | 17 | 19 | 10.2% | 10.2% | 10.6% | 10.8% |
| Minnesota | 17 | 17 | 16 | 16 | 10.0% | 10.1% | 10.9% | 11.0% |
| Oregon | 18 | 18 | 18 | 17 | 9.9% | 10.0% | 10.5% | 10.8% |
| New Mexico | 19 | 20 | 21 | 21 | 9.8% | 9.7% | 9.9% | 10.0% |
| Kansas | 20 | 19 | 19 | 18 | 9.8% | 9.9% | 10.5% | 10.8% |
| Michigan | 21 | 22 | 23 | 22 | 9.4% | 9.5% | 9.8% | 10.0% |
| Georgia | 22 | 21 | 20 | 20 | 9.4% | 9.5% | 10.1% | 10.4% |
| Hawaii | 23 | 24 | 26 | 26 | 9.4% | 9.3% | 9.4% | 9.6% |
| Missouri | 24 | 23 | 22 | 23 | 9.3% | 9.4% | 9.9% | 9.9% |
| Ohio | 25 | 26 | 25 | 27 | 8.9% | 9.0% | 9.4% | 9.6% |
| Alaska | 26 | 25 | 24 | 28 | 8.8% | 9.1% | 9.5% | 9.4% |
| Maine | 27 | 27 | 29 | 30 | 8.8% | 9.0% | 9.2% | 9.3% |
| Arizona | 28 | 29 | 32 | 31 | 8.8% | 8.6% | 9.0% | 9.2% |
| Utah | 29 | 31 | 30 | 29 | 8.6% | 8.5% | 9.0% | 9.3% |
| Nebraska | 30 | 32 | 28 | 24 | 8.6% | 8.5% | 9.3% | 9.7% |
| Wisconsin | 31 | 28 | 31 | 32 | 8.6% | 8.7% | 9.0% | 9.1% |
| Florida | 32 | 30 | 33 | 33 | 8.6% | 8.6% | 8.9% | 9.0% |
| North Carolina | 33 | 33 | 27 | 25 | 8.4% | 8.5% | 9.4% | 9.7% |
| Kentucky | 34 | 35 | 34 | 34 | 8.2% | 8.1% | 8.8% | 8.9% |
| Montana | 35 | 34 | 37 | 39 | 8.2% | 8.3% | 8.5% | 8.5% |
| South Carolina | 36 | 37 | 39 | 37 | 8.1% | 8.0% | 8.4% | 8.7% |
| Texas | 37 | 36 | 36 | 36 | 8.0% | 8.1% | 8.6% | 8.8% |
| Tennessee | 38 | 38 | 35 | 35 | 7.8% | 7.9% | 8.7% | 8.8% |
| Indiana | 39 | 40 | 42 | 42 | 7.8% | 7.7% | 8.0% | 8.1% |
| Iowa | 40 | 39 | 38 | 38 | 7.7% | 7.8% | 8.4% | 8.6% |
| Alabama | 41 | 41 | 41 | 40 | 7.6% | 7.7% | 8.1% | 8.3% |
| Wyoming | 42 | 42 | 40 | 41 | 7.4% | 7.6% | 8.1% | 8.2% |
| South Dakota | 43 | 44 | 48 | 45 | 7.2% | 7.1% | 7.0% | 7.4% |
| Idaho | 44 | 43 | 43 | 44 | 7.1% | 7.3% | 7.5% | 7.6% |
| North Dakota | 45 | 47 | 46 | 47 | 6.9% | 6.8% | 7.2% | 7.3% |
| Oklahoma | 46 | 45 | 45 | 46 | 6.9% | 6.9% | 7.3% | 7.4% |
| West Virginia | 47 | 46 | 44 | 43 | 6.8% | 6.8% | 7.4% | 7.7% |
| Nevada | 48 | 48 | 51 | 51 | 6.8% | 6.7% | 6.9% | 6.9% |
| Mississippi | 49 | 49 | 50 | 50 | 6.6% | 6.6% | 6.9% | 7.1% |
| Louisiana | 50 | 50 | 49 | 48 | 6.5% | 6.4% | 7.0% | 7.2% |
| Arkansas | 51 | 51 | 47 | 49 | 6.2% | 6.3% | 7.0% | 7.1% |
Observing the above table, it shows every single state listed, including District of Columbia, is making progresses in improving its educational attainment level. Ranking with the percent difference between the first and last available educational attainment level, it shows that District of Columbia leading the improvement with a change of 4.14% followed by Virginia, North Carolina, Massachusetts, and Nebraska. Rounding up the top ten, here comes the Maryland, Tennessee, Pennsylvania, Georgia, and Minnesota.
============
Ranking states by percent of Doctor or Professional degree holder
| Stt Nm | 2010 Rank | 2011 Rank | 2015 Rank | 2016 Rank | 2010 % | 2011 % | 2015 % | 2016 % |
|---|---|---|---|---|---|---|---|---|
| District of Columbia | 1 | 1 | 1 | 1 | 10.9% | 10.8% | 11.0% | 11.2% |
| Maryland | 2 | 2 | 3 | 3 | 4.9% | 4.9% | 4.9% | 4.9% |
| Massachusetts | 3 | 3 | 2 | 2 | 4.8% | 4.8% | 5.0% | 5.1% |
| Connecticut | 4 | 4 | 4 | 4 | 4.1% | 4.2% | 4.3% | 4.3% |
| New York | 5 | 5 | 5 | 6 | 3.8% | 3.8% | 3.9% | 3.9% |
| Virginia | 6 | 6 | 6 | 7 | 3.6% | 3.6% | 3.8% | 3.8% |
| New Jersey | 7 | 7 | 7 | 8 | 3.6% | 3.6% | 3.7% | 3.7% |
| Vermont | 8 | 9 | 8 | 5 | 3.3% | 3.3% | 3.6% | 3.9% |
| California | 9 | 8 | 10 | 10 | 3.3% | 3.3% | 3.3% | 3.4% |
| Rhode Island | 10 | 10 | 9 | 9 | 3.2% | 3.2% | 3.4% | 3.6% |
| Hawaii | 11 | 15 | 18 | 17 | 3.2% | 3.0% | 3.0% | 3.1% |
| Colorado | 12 | 11 | 11 | 11 | 3.1% | 3.1% | 3.3% | 3.3% |
| Pennsylvania | 13 | 14 | 14 | 14 | 3.1% | 3.0% | 3.1% | 3.2% |
| Delaware | 14 | 16 | 15 | 15 | 3.1% | 3.0% | 3.1% | 3.1% |
| Oregon | 15 | 13 | 16 | 16 | 3.1% | 3.1% | 3.0% | 3.1% |
| Illinois | 16 | 12 | 13 | 13 | 3.1% | 3.1% | 3.2% | 3.2% |
| New Mexico | 17 | 18 | 22 | 22 | 3.0% | 3.0% | 2.8% | 2.8% |
| Washington | 18 | 17 | 17 | 18 | 3.0% | 3.0% | 3.0% | 3.0% |
| Minnesota | 19 | 19 | 12 | 12 | 3.0% | 3.0% | 3.2% | 3.3% |
| New Hampshire | 20 | 20 | 19 | 20 | 2.8% | 2.8% | 3.0% | 2.9% |
| Nebraska | 21 | 23 | 26 | 23 | 2.7% | 2.6% | 2.7% | 2.7% |
| Florida | 22 | 22 | 25 | 26 | 2.7% | 2.6% | 2.7% | 2.7% |
| Georgia | 23 | 21 | 21 | 19 | 2.7% | 2.7% | 2.9% | 3.0% |
| Kansas | 24 | 25 | 24 | 24 | 2.6% | 2.6% | 2.7% | 2.7% |
| Alaska | 25 | 24 | 20 | 21 | 2.6% | 2.6% | 2.9% | 2.8% |
| Missouri | 26 | 26 | 27 | 27 | 2.5% | 2.6% | 2.6% | 2.6% |
| Utah | 27 | 30 | 31 | 31 | 2.5% | 2.4% | 2.5% | 2.6% |
| Montana | 28 | 27 | 37 | 30 | 2.5% | 2.6% | 2.4% | 2.6% |
| Michigan | 29 | 28 | 32 | 33 | 2.5% | 2.5% | 2.5% | 2.5% |
| Ohio | 30 | 29 | 33 | 35 | 2.4% | 2.4% | 2.5% | 2.5% |
| Arizona | 31 | 36 | 36 | 36 | 2.4% | 2.3% | 2.4% | 2.5% |
| Wisconsin | 32 | 35 | 38 | 37 | 2.4% | 2.4% | 2.4% | 2.5% |
| Iowa | 33 | 33 | 28 | 28 | 2.4% | 2.4% | 2.6% | 2.6% |
| North Carolina | 34 | 34 | 30 | 29 | 2.4% | 2.4% | 2.5% | 2.6% |
| Maine | 35 | 31 | 23 | 25 | 2.4% | 2.4% | 2.7% | 2.7% |
| Tennessee | 36 | 32 | 29 | 34 | 2.4% | 2.4% | 2.5% | 2.5% |
| Kentucky | 37 | 38 | 35 | 38 | 2.3% | 2.3% | 2.4% | 2.5% |
| Texas | 38 | 39 | 40 | 39 | 2.3% | 2.3% | 2.3% | 2.3% |
| Idaho | 39 | 37 | 41 | 41 | 2.3% | 2.3% | 2.2% | 2.3% |
| South Dakota | 40 | 40 | 47 | 42 | 2.2% | 2.2% | 2.0% | 2.3% |
| Indiana | 41 | 43 | 44 | 45 | 2.2% | 2.1% | 2.1% | 2.1% |
| Louisiana | 42 | 44 | 42 | 40 | 2.2% | 2.1% | 2.2% | 2.3% |
| Wyoming | 43 | 41 | 34 | 32 | 2.1% | 2.2% | 2.5% | 2.5% |
| North Dakota | 44 | 42 | 39 | 44 | 2.1% | 2.1% | 2.3% | 2.2% |
| South Carolina | 45 | 47 | 46 | 46 | 2.1% | 2.1% | 2.1% | 2.1% |
| Alabama | 46 | 46 | 43 | 43 | 2.1% | 2.1% | 2.2% | 2.2% |
| Nevada | 47 | 45 | 48 | 49 | 2.1% | 2.1% | 2.0% | 2.0% |
| Oklahoma | 48 | 50 | 45 | 47 | 2.0% | 2.0% | 2.1% | 2.1% |
| Mississippi | 49 | 49 | 51 | 51 | 2.0% | 2.0% | 1.9% | 1.9% |
| West Virginia | 50 | 48 | 49 | 48 | 1.9% | 2.0% | 2.0% | 2.0% |
| Arkansas | 51 | 51 | 50 | 50 | 1.8% | 1.7% | 1.9% | 1.9% |
Sunday, January 28, 2018
Brain Drain - Ranking and Analysis with 2016 ACS PUMS
This is a data update to my previous article Brain Drain - Ranking and Analysis with 2015 ACS data, which reports brain drain analysis based on the 2015 5-year ACS PUMS data. This article presents the same kind of information based on the 2016 5-year ACS PUMS data. For terms used in the analysis, please referring to the aforementioned ACS 2015 article.
As with previous article, the presentation is hosted at Tableau's public web portal here.
Tables presented in my previous article is updated below.
Net (in) Migration per 1000 22-64 years old population
| State | Ed. Attainment | per 1000 Rsd | Upper | Lower |
|---|---|---|---|---|
| Washington | 6. Grdts | 2.4 | 2.8 | 1.9 |
| Colorado | 6. Grdts | 1.5 | 2.2 | 0.8 |
| Montana | 6. Grdts | 1.5 | 3.0 | 0.0 |
| Delaware | 6. Grdts | 1.5 | 2.9 | 0.0 |
| Oregon | 6. Grdts | 1.2 | 1.9 | 0.5 |
| New Hampshire | 6. Grdts | 1.1 | 2.5 | -0.2 |
| South Carolina | 6. Grdts | 1.1 | 1.6 | 0.7 |
| Texas | 6. Grdts | 1.0 | 1.1 | 0.8 |
| Utah | 6. Grdts | 0.9 | 1.7 | 0.1 |
| Nevada | 6. Grdts | 0.9 | 1.6 | 0.2 |
| Arizona | 6. Grdts | 0.8 | 1.3 | 0.3 |
| Vermont | 6. Grdts | 0.8 | 3.3 | -1.8 |
| North Carolina | 6. Grdts | 0.7 | 1.2 | 0.3 |
| Idaho | 6. Grdts | 0.7 | 1.7 | -0.3 |
| Maine | 6. Grdts | 0.6 | 1.8 | -0.5 |
| California | 6. Grdts | 0.6 | 0.8 | 0.4 |
| Florida | 6. Grdts | 0.6 | 0.8 | 0.3 |
| New Mexico | 6. Grdts | 0.4 | 1.4 | -0.5 |
| Maryland | 6. Grdts | 0.4 | 1.0 | -0.2 |
| Minnesota | 6. Grdts | 0.4 | 0.9 | -0.2 |
| South Dakota | 6. Grdts | 0.3 | 1.5 | -1.0 |
| Wyoming | 6. Grdts | 0.1 | 1.8 | -1.5 |
| Alabama | 6. Grdts | 0.1 | 0.6 | -0.3 |
| Tennessee | 6. Grdts | 0.1 | 0.5 | -0.3 |
| Iowa | 6. Grdts | 0.1 | 0.7 | -0.6 |
| Virginia | 6. Grdts | 0.0 | 0.6 | -0.5 |
| Arkansas | 6. Grdts | -0.1 | 0.5 | -0.7 |
| Georgia | 6. Grdts | -0.2 | 0.2 | -0.6 |
| Louisiana | 6. Grdts | -0.2 | 0.2 | -0.6 |
| North Dakota | 6. Grdts | -0.3 | 1.6 | -2.1 |
| Wisconsin | 6. Grdts | -0.4 | 0.1 | -0.9 |
| Hawaii | 6. Grdts | -0.4 | 0.8 | -1.6 |
| Ohio | 6. Grdts | -0.5 | -0.1 | -0.8 |
| Connecticut | 6. Grdts | -0.5 | 0.2 | -1.1 |
| Mississippi | 6. Grdts | -0.5 | 0.0 | -1.0 |
| Massachusetts | 6. Grdts | -0.6 | 0.0 | -1.2 |
| Kansas | 6. Grdts | -0.6 | 0.2 | -1.5 |
| Nebraska | 6. Grdts | -0.6 | 0.3 | -1.5 |
| Indiana | 6. Grdts | -0.6 | -0.3 | -1.0 |
| Michigan | 6. Grdts | -0.7 | -0.4 | -1.0 |
| West Virginia | 6. Grdts | -0.8 | -0.1 | -1.4 |
| Pennsylvania | 6. Grdts | -0.9 | -0.6 | -1.2 |
| Kentucky | 6. Grdts | -0.9 | -0.5 | -1.3 |
| Missouri | 6. Grdts | -0.9 | -0.5 | -1.4 |
| New Jersey | 6. Grdts | -1.0 | -0.7 | -1.4 |
| Oklahoma | 6. Grdts | -1.1 | -0.5 | -1.6 |
| Illinois | 6. Grdts | -1.4 | -1.0 | -1.7 |
| Rhode Island | 6. Grdts | -1.4 | 0.1 | -2.9 |
| New York | 6. Grdts | -1.6 | -1.3 | -1.9 |
| Alaska | 6. Grdts | -4.1 | -1.8 | -6.3 |
| District of Columbia | 6. Grdts | -5.0 | -1.1 | -8.9 |
| Colorado | 5. BchlrDgr | 4.1 | 5.1 | 3.1 |
| Washington | 5. BchlrDgr | 2.8 | 3.6 | 2.0 |
| Oregon | 5. BchlrDgr | 2.4 | 3.4 | 1.3 |
| Nevada | 5. BchlrDgr | 2.4 | 3.3 | 1.4 |
| Arizona | 5. BchlrDgr | 2.0 | 2.8 | 1.2 |
| Texas | 5. BchlrDgr | 1.5 | 1.8 | 1.3 |
| North Carolina | 5. BchlrDgr | 1.3 | 1.9 | 0.7 |
| Florida | 5. BchlrDgr | 1.2 | 1.6 | 0.9 |
| Maine | 5. BchlrDgr | 1.2 | 2.9 | -0.5 |
| South Carolina | 5. BchlrDgr | 1.1 | 2.0 | 0.2 |
| Tennessee | 5. BchlrDgr | 1.0 | 1.8 | 0.3 |
| New Hampshire | 5. BchlrDgr | 0.9 | 2.7 | -1.0 |
| Idaho | 5. BchlrDgr | 0.7 | 2.3 | -0.9 |
| California | 5. BchlrDgr | 0.6 | 0.9 | 0.4 |
| Louisiana | 5. BchlrDgr | 0.6 | 1.4 | -0.1 |
| Arkansas | 5. BchlrDgr | 0.5 | 1.3 | -0.4 |
| Virginia | 5. BchlrDgr | 0.4 | 1.0 | -0.3 |
| Georgia | 5. BchlrDgr | 0.1 | 0.7 | -0.4 |
| Kentucky | 5. BchlrDgr | 0.1 | 0.8 | -0.5 |
| District of Columbia | 5. BchlrDgr | 0.1 | 3.4 | -3.2 |
| Hawaii | 5. BchlrDgr | -0.1 | 1.5 | -1.7 |
| Maryland | 5. BchlrDgr | -0.2 | 0.8 | -1.1 |
| Delaware | 5. BchlrDgr | -0.2 | 1.6 | -2.0 |
| Minnesota | 5. BchlrDgr | -0.4 | 0.5 | -1.3 |
| Kansas | 5. BchlrDgr | -0.6 | 0.7 | -1.8 |
| Massachusetts | 5. BchlrDgr | -0.7 | 0.0 | -1.4 |
| Alabama | 5. BchlrDgr | -0.8 | -0.1 | -1.6 |
| Illinois | 5. BchlrDgr | -0.9 | -0.4 | -1.3 |
| Nebraska | 5. BchlrDgr | -0.9 | 0.3 | -2.2 |
| Missouri | 5. BchlrDgr | -0.9 | -0.1 | -1.7 |
| Wyoming | 5. BchlrDgr | -0.9 | 2.6 | -4.5 |
| Oklahoma | 5. BchlrDgr | -1.2 | -0.4 | -1.9 |
| Connecticut | 5. BchlrDgr | -1.2 | -0.2 | -2.2 |
| Montana | 5. BchlrDgr | -1.2 | 0.8 | -3.2 |
| South Dakota | 5. BchlrDgr | -1.2 | 0.9 | -3.3 |
| New York | 5. BchlrDgr | -1.3 | -0.9 | -1.6 |
| Michigan | 5. BchlrDgr | -1.3 | -0.8 | -1.7 |
| Ohio | 5. BchlrDgr | -1.3 | -0.8 | -1.8 |
| Indiana | 5. BchlrDgr | -1.3 | -0.8 | -1.9 |
| Mississippi | 5. BchlrDgr | -1.4 | -0.6 | -2.3 |
| Pennsylvania | 5. BchlrDgr | -1.5 | -1.1 | -1.9 |
| Wisconsin | 5. BchlrDgr | -1.7 | -0.9 | -2.5 |
| Utah | 5. BchlrDgr | -1.8 | -0.7 | -2.8 |
| West Virginia | 5. BchlrDgr | -1.8 | -1.0 | -2.7 |
| New Mexico | 5. BchlrDgr | -2.1 | -1.0 | -3.1 |
| New Jersey | 5. BchlrDgr | -2.6 | -2.1 | -3.1 |
| Iowa | 5. BchlrDgr | -2.6 | -1.7 | -3.6 |
| North Dakota | 5. BchlrDgr | -3.4 | -0.7 | -6.1 |
| Rhode Island | 5. BchlrDgr | -4.2 | -2.4 | -6.0 |
| Vermont | 5. BchlrDgr | -6.0 | -3.0 | -8.9 |
| Alaska | 5. BchlrDgr | -8.8 | -5.3 | -12.2 |
| Delaware | 4. AssctDgr | 2.6 | 3.5 | 1.6 |
| North Dakota | 4. AssctDgr | 2.0 | 4.0 | 0.0 |
| Montana | 4. AssctDgr | 1.5 | 3.0 | 0.0 |
| Florida | 4. AssctDgr | 0.8 | 1.0 | 0.6 |
| Idaho | 4. AssctDgr | 0.8 | 1.7 | -0.1 |
| Colorado | 4. AssctDgr | 0.7 | 1.2 | 0.2 |
| Arizona | 4. AssctDgr | 0.7 | 1.1 | 0.3 |
| South Carolina | 4. AssctDgr | 0.7 | 1.2 | 0.2 |
| Utah | 4. AssctDgr | 0.7 | 1.3 | 0.0 |
| Nevada | 4. AssctDgr | 0.7 | 1.3 | 0.0 |
| Oregon | 4. AssctDgr | 0.6 | 1.1 | 0.1 |
| North Carolina | 4. AssctDgr | 0.5 | 0.8 | 0.2 |
| Maine | 4. AssctDgr | 0.5 | 1.3 | -0.4 |
| Hawaii | 4. AssctDgr | 0.5 | 1.6 | -0.7 |
| Kentucky | 4. AssctDgr | 0.4 | 0.8 | -0.1 |
| Texas | 4. AssctDgr | 0.4 | 0.5 | 0.2 |
| Nebraska | 4. AssctDgr | 0.4 | 1.2 | -0.5 |
| Tennessee | 4. AssctDgr | 0.3 | 0.7 | -0.1 |
| Missouri | 4. AssctDgr | 0.3 | 0.7 | -0.1 |
| Wisconsin | 4. AssctDgr | 0.3 | 0.6 | -0.1 |
| Washington | 4. AssctDgr | 0.3 | 0.7 | -0.1 |
| Alabama | 4. AssctDgr | 0.3 | 0.7 | -0.2 |
| South Dakota | 4. AssctDgr | 0.2 | 1.8 | -1.4 |
| Iowa | 4. AssctDgr | 0.1 | 0.8 | -0.6 |
| Virginia | 4. AssctDgr | 0.1 | 0.3 | -0.2 |
| West Virginia | 4. AssctDgr | 0.1 | 0.8 | -0.7 |
| Ohio | 4. AssctDgr | 0.0 | 0.2 | -0.2 |
| Maryland | 4. AssctDgr | 0.0 | 0.4 | -0.3 |
| Massachusetts | 4. AssctDgr | 0.0 | 0.3 | -0.3 |
| Mississippi | 4. AssctDgr | 0.0 | 0.5 | -0.5 |
| Oklahoma | 4. AssctDgr | 0.0 | 0.4 | -0.4 |
| New Hampshire | 4. AssctDgr | -0.1 | 0.8 | -1.0 |
| Indiana | 4. AssctDgr | -0.1 | 0.2 | -0.4 |
| Georgia | 4. AssctDgr | -0.1 | 0.2 | -0.4 |
| Louisiana | 4. AssctDgr | -0.2 | 0.2 | -0.5 |
| New Jersey | 4. AssctDgr | -0.2 | 0.0 | -0.4 |
| Wyoming | 4. AssctDgr | -0.2 | 2.6 | -2.9 |
| Michigan | 4. AssctDgr | -0.2 | 0.0 | -0.4 |
| California | 4. AssctDgr | -0.3 | -0.2 | -0.4 |
| New Mexico | 4. AssctDgr | -0.4 | 0.2 | -1.0 |
| Kansas | 4. AssctDgr | -0.4 | 0.2 | -1.0 |
| Connecticut | 4. AssctDgr | -0.4 | 0.0 | -0.8 |
| Arkansas | 4. AssctDgr | -0.5 | -0.1 | -0.8 |
| Minnesota | 4. AssctDgr | -0.5 | 0.0 | -1.0 |
| Pennsylvania | 4. AssctDgr | -0.5 | -0.2 | -0.8 |
| Illinois | 4. AssctDgr | -0.7 | -0.5 | -1.0 |
| Rhode Island | 4. AssctDgr | -0.8 | 0.1 | -1.8 |
| New York | 4. AssctDgr | -0.9 | -0.8 | -1.1 |
| Vermont | 4. AssctDgr | -2.0 | -0.8 | -3.2 |
| District of Columbia | 4. AssctDgr | -2.1 | -0.9 | -3.3 |
| Alaska | 4. AssctDgr | -3.5 | -1.4 | -5.6 |
| North Dakota | 3. SomeCllg | 5.2 | 8.0 | 2.4 |
| Oregon | 3. SomeCllg | 3.3 | 4.2 | 2.5 |
| Nevada | 3. SomeCllg | 3.3 | 4.5 | 2.1 |
| Wyoming | 3. SomeCllg | 2.4 | 5.8 | -1.0 |
| Colorado | 3. SomeCllg | 2.3 | 3.3 | 1.4 |
| Arizona | 3. SomeCllg | 2.0 | 2.8 | 1.3 |
| Idaho | 3. SomeCllg | 1.9 | 3.6 | 0.2 |
| South Dakota | 3. SomeCllg | 1.7 | 3.6 | -0.2 |
| Delaware | 3. SomeCllg | 1.5 | 3.4 | -0.3 |
| Utah | 3. SomeCllg | 1.3 | 2.6 | 0.1 |
| South Carolina | 3. SomeCllg | 1.3 | 2.2 | 0.4 |
| Montana | 3. SomeCllg | 1.2 | 3.2 | -0.8 |
| Florida | 3. SomeCllg | 1.2 | 1.5 | 0.8 |
| Arkansas | 3. SomeCllg | 1.2 | 2.2 | 0.1 |
| Texas | 3. SomeCllg | 1.0 | 1.4 | 0.7 |
| Alabama | 3. SomeCllg | 0.8 | 1.5 | 0.1 |
| Georgia | 3. SomeCllg | 0.8 | 1.4 | 0.2 |
| Maine | 3. SomeCllg | 0.8 | 2.1 | -0.6 |
| Vermont | 3. SomeCllg | 0.7 | 2.7 | -1.2 |
| North Carolina | 3. SomeCllg | 0.7 | 1.2 | 0.1 |
| Tennessee | 3. SomeCllg | 0.7 | 1.4 | -0.1 |
| Hawaii | 3. SomeCllg | 0.6 | 2.6 | -1.4 |
| Missouri | 3. SomeCllg | 0.6 | 1.2 | 0.0 |
| New Hampshire | 3. SomeCllg | 0.6 | 1.9 | -0.7 |
| Kentucky | 3. SomeCllg | 0.5 | 1.4 | -0.3 |
| Washington | 3. SomeCllg | 0.3 | 1.0 | -0.4 |
| Nebraska | 3. SomeCllg | 0.3 | 1.6 | -1.1 |
| Wisconsin | 3. SomeCllg | 0.3 | 0.9 | -0.3 |
| Virginia | 3. SomeCllg | 0.1 | 0.7 | -0.5 |
| Oklahoma | 3. SomeCllg | 0.0 | 0.9 | -0.8 |
| Iowa | 3. SomeCllg | 0.0 | 0.9 | -0.9 |
| Ohio | 3. SomeCllg | 0.0 | 0.4 | -0.4 |
| Indiana | 3. SomeCllg | 0.0 | 0.6 | -0.7 |
| Kansas | 3. SomeCllg | -0.1 | 0.9 | -1.2 |
| Rhode Island | 3. SomeCllg | -0.2 | 1.1 | -1.4 |
| West Virginia | 3. SomeCllg | -0.2 | 0.9 | -1.3 |
| Louisiana | 3. SomeCllg | -0.3 | 0.6 | -1.1 |
| Massachusetts | 3. SomeCllg | -0.4 | 0.1 | -0.9 |
| Mississippi | 3. SomeCllg | -0.4 | 0.6 | -1.5 |
| Maryland | 3. SomeCllg | -0.5 | 0.1 | -1.1 |
| Pennsylvania | 3. SomeCllg | -0.5 | -0.1 | -0.8 |
| Michigan | 3. SomeCllg | -0.6 | -0.2 | -1.0 |
| Minnesota | 3. SomeCllg | -0.6 | 0.0 | -1.2 |
| Connecticut | 3. SomeCllg | -0.7 | -0.1 | -1.4 |
| New Mexico | 3. SomeCllg | -0.8 | 0.5 | -2.1 |
| District of Columbia | 3. SomeCllg | -1.3 | 1.0 | -3.5 |
| California | 3. SomeCllg | -1.3 | -1.1 | -1.5 |
| New Jersey | 3. SomeCllg | -1.4 | -1.1 | -1.8 |
| Illinois | 3. SomeCllg | -1.5 | -1.1 | -1.8 |
| New York | 3. SomeCllg | -1.9 | -1.7 | -2.1 |
| Alaska | 3. SomeCllg | -14.1 | -10.0 | -18.1 |
| Nevada | 2. HsDgrEqv | 3.2 | 4.4 | 2.0 |
| Idaho | 2. HsDgrEqv | 2.8 | 4.3 | 1.3 |
| Delaware | 2. HsDgrEqv | 2.2 | 4.0 | 0.3 |
| Florida | 2. HsDgrEqv | 2.1 | 2.5 | 1.7 |
| Oregon | 2. HsDgrEqv | 1.7 | 2.3 | 1.0 |
| New Hampshire | 2. HsDgrEqv | 1.5 | 2.8 | 0.1 |
| South Carolina | 2. HsDgrEqv | 1.4 | 2.3 | 0.6 |
| Arizona | 2. HsDgrEqv | 1.4 | 2.1 | 0.8 |
| Arkansas | 2. HsDgrEqv | 1.4 | 2.5 | 0.3 |
| Colorado | 2. HsDgrEqv | 1.1 | 1.7 | 0.4 |
| Washington | 2. HsDgrEqv | 1.0 | 1.6 | 0.4 |
| Georgia | 2. HsDgrEqv | 0.9 | 1.3 | 0.5 |
| New Mexico | 2. HsDgrEqv | 0.9 | 2.0 | -0.2 |
| Utah | 2. HsDgrEqv | 0.7 | 1.6 | -0.1 |
| Texas | 2. HsDgrEqv | 0.7 | 1.0 | 0.4 |
| North Dakota | 2. HsDgrEqv | 0.7 | 4.0 | -2.7 |
| Tennessee | 2. HsDgrEqv | 0.6 | 1.3 | 0.0 |
| Indiana | 2. HsDgrEqv | 0.5 | 1.0 | 0.0 |
| North Carolina | 2. HsDgrEqv | 0.5 | 1.0 | -0.1 |
| Nebraska | 2. HsDgrEqv | 0.4 | 1.5 | -0.7 |
| Louisiana | 2. HsDgrEqv | 0.3 | 1.0 | -0.4 |
| Kentucky | 2. HsDgrEqv | 0.3 | 1.1 | -0.5 |
| Iowa | 2. HsDgrEqv | 0.3 | 1.3 | -0.7 |
| Missouri | 2. HsDgrEqv | 0.3 | 0.9 | -0.3 |
| Oklahoma | 2. HsDgrEqv | 0.3 | 1.3 | -0.8 |
| Wisconsin | 2. HsDgrEqv | 0.2 | 0.7 | -0.2 |
| Virginia | 2. HsDgrEqv | 0.2 | 0.7 | -0.3 |
| Ohio | 2. HsDgrEqv | 0.2 | 0.5 | -0.2 |
| Montana | 2. HsDgrEqv | 0.1 | 2.1 | -1.9 |
| West Virginia | 2. HsDgrEqv | -0.1 | 1.6 | -1.7 |
| Maryland | 2. HsDgrEqv | -0.1 | 0.5 | -0.6 |
| Michigan | 2. HsDgrEqv | -0.1 | 0.2 | -0.5 |
| Alabama | 2. HsDgrEqv | -0.3 | 0.4 | -1.0 |
| Pennsylvania | 2. HsDgrEqv | -0.3 | 0.1 | -0.7 |
| Kansas | 2. HsDgrEqv | -0.3 | 0.8 | -1.4 |
| Minnesota | 2. HsDgrEqv | -0.4 | 0.1 | -0.9 |
| Maine | 2. HsDgrEqv | -0.4 | 0.9 | -1.7 |
| Mississippi | 2. HsDgrEqv | -0.5 | 0.5 | -1.6 |
| Rhode Island | 2. HsDgrEqv | -0.7 | 0.6 | -2.0 |
| Wyoming | 2. HsDgrEqv | -0.8 | 2.5 | -4.0 |
| New Jersey | 2. HsDgrEqv | -1.0 | -0.6 | -1.4 |
| California | 2. HsDgrEqv | -1.0 | -0.8 | -1.2 |
| South Dakota | 2. HsDgrEqv | -1.1 | 0.7 | -3.0 |
| Massachusetts | 2. HsDgrEqv | -1.2 | -0.7 | -1.6 |
| Connecticut | 2. HsDgrEqv | -1.2 | -0.6 | -1.8 |
| Illinois | 2. HsDgrEqv | -1.3 | -0.9 | -1.6 |
| Vermont | 2. HsDgrEqv | -1.4 | 0.0 | -2.9 |
| New York | 2. HsDgrEqv | -1.9 | -1.6 | -2.1 |
| Hawaii | 2. HsDgrEqv | -2.0 | -0.2 | -3.7 |
| District of Columbia | 2. HsDgrEqv | -7.4 | -5.5 | -9.4 |
| Alaska | 2. HsDgrEqv | -20.4 | -17.0 | -23.9 |
| Delaware | 1. LssHsDgr | 1.2 | 2.3 | 0.2 |
| Oklahoma | 1. LssHsDgr | 1.0 | 1.6 | 0.4 |
| Wyoming | 1. LssHsDgr | 0.9 | 3.1 | -1.2 |
| Nevada | 1. LssHsDgr | 0.9 | 1.7 | 0.1 |
| Kansas | 1. LssHsDgr | 0.7 | 1.3 | 0.0 |
| South Dakota | 1. LssHsDgr | 0.6 | 1.9 | -0.7 |
| Minnesota | 1. LssHsDgr | 0.5 | 0.9 | 0.2 |
| Georgia | 1. LssHsDgr | 0.5 | 0.8 | 0.2 |
| Louisiana | 1. LssHsDgr | 0.5 | 0.9 | 0.1 |
| North Dakota | 1. LssHsDgr | 0.5 | 1.5 | -0.5 |
| Wisconsin | 1. LssHsDgr | 0.5 | 0.8 | 0.2 |
| Mississippi | 1. LssHsDgr | 0.5 | 1.1 | -0.2 |
| Texas | 1. LssHsDgr | 0.4 | 0.6 | 0.3 |
| Tennessee | 1. LssHsDgr | 0.4 | 0.8 | 0.0 |
| Oregon | 1. LssHsDgr | 0.4 | 0.9 | -0.1 |
| Colorado | 1. LssHsDgr | 0.4 | 0.8 | 0.0 |
| Washington | 1. LssHsDgr | 0.4 | 0.8 | 0.1 |
| Michigan | 1. LssHsDgr | 0.3 | 0.6 | 0.1 |
| New Mexico | 1. LssHsDgr | 0.3 | 1.1 | -0.4 |
| West Virginia | 1. LssHsDgr | 0.3 | 1.1 | -0.5 |
| Ohio | 1. LssHsDgr | 0.3 | 0.5 | 0.0 |
| Kentucky | 1. LssHsDgr | 0.3 | 0.7 | -0.2 |
| Indiana | 1. LssHsDgr | 0.3 | 0.6 | -0.1 |
| Pennsylvania | 1. LssHsDgr | 0.3 | 0.5 | 0.0 |
| Rhode Island | 1. LssHsDgr | 0.2 | 1.2 | -0.7 |
| Arkansas | 1. LssHsDgr | 0.2 | 0.9 | -0.5 |
| Missouri | 1. LssHsDgr | 0.2 | 0.6 | -0.2 |
| Utah | 1. LssHsDgr | 0.1 | 0.7 | -0.5 |
| Iowa | 1. LssHsDgr | 0.1 | 0.7 | -0.5 |
| Maryland | 1. LssHsDgr | 0.0 | 0.4 | -0.3 |
| Florida | 1. LssHsDgr | 0.0 | 0.2 | -0.2 |
| North Carolina | 1. LssHsDgr | 0.0 | 0.3 | -0.3 |
| Virginia | 1. LssHsDgr | 0.0 | 0.3 | -0.3 |
| Connecticut | 1. LssHsDgr | 0.0 | 0.4 | -0.4 |
| South Carolina | 1. LssHsDgr | -0.1 | 0.3 | -0.5 |
| Montana | 1. LssHsDgr | -0.1 | 1.0 | -1.2 |
| Arizona | 1. LssHsDgr | -0.1 | 0.3 | -0.6 |
| New Jersey | 1. LssHsDgr | -0.2 | 0.1 | -0.4 |
| Nebraska | 1. LssHsDgr | -0.2 | 0.6 | -1.0 |
| New Hampshire | 1. LssHsDgr | -0.2 | 0.6 | -1.1 |
| California | 1. LssHsDgr | -0.4 | -0.3 | -0.5 |
| Massachusetts | 1. LssHsDgr | -0.4 | -0.1 | -0.8 |
| Alabama | 1. LssHsDgr | -0.5 | 0.0 | -1.0 |
| Hawaii | 1. LssHsDgr | -0.6 | -0.1 | -1.2 |
| Vermont | 1. LssHsDgr | -0.6 | 0.6 | -1.9 |
| Illinois | 1. LssHsDgr | -0.7 | -0.5 | -0.9 |
| Maine | 1. LssHsDgr | -0.7 | 0.0 | -1.4 |
| Idaho | 1. LssHsDgr | -0.8 | 0.2 | -1.8 |
| New York | 1. LssHsDgr | -0.9 | -0.7 | -1.0 |
| District of Columbia | 1. LssHsDgr | -2.5 | -1.2 | -3.8 |
| Alaska | 1. LssHsDgr | -8.0 | -6.0 | -10.0 |
Net (in) Migration per 1000 Ed-Attainment Rsd.( 22-64 years old)
| State | Ed. Attainment | per 1000 Ed.Rsd | Upper | Lower |
|---|---|---|---|---|
| Washington | 6. Grdts | 21.1 | 25.1 | 17.0 |
| Montana | 6. Grdts | 17.3 | 35.1 | -0.5 |
| South Carolina | 6. Grdts | 13.2 | 18.7 | 7.7 |
| Nevada | 6. Grdts | 13.0 | 22.5 | 3.5 |
| Delaware | 6. Grdts | 12.5 | 25.0 | 0.0 |
| Colorado | 6. Grdts | 11.5 | 17.0 | 5.9 |
| Oregon | 6. Grdts | 11.1 | 17.8 | 4.3 |
| Texas | 6. Grdts | 10.9 | 12.9 | 9.0 |
| Utah | 6. Grdts | 9.8 | 18.7 | 0.9 |
| Idaho | 6. Grdts | 9.4 | 22.8 | -3.9 |
| New Hampshire | 6. Grdts | 9.1 | 19.9 | -1.7 |
| Arizona | 6. Grdts | 8.5 | 14.0 | 3.0 |
| North Carolina | 6. Grdts | 7.7 | 12.0 | 3.3 |
| Maine | 6. Grdts | 6.9 | 18.9 | -5.0 |
| Florida | 6. Grdts | 6.3 | 9.2 | 3.5 |
| Vermont | 6. Grdts | 5.9 | 25.6 | -13.7 |
| California | 6. Grdts | 5.6 | 7.2 | 3.9 |
| New Mexico | 6. Grdts | 4.5 | 13.5 | -4.6 |
| South Dakota | 6. Grdts | 3.4 | 20.4 | -13.5 |
| Minnesota | 6. Grdts | 3.3 | 8.3 | -1.6 |
| Maryland | 6. Grdts | 2.4 | 6.0 | -1.3 |
| Wyoming | 6. Grdts | 1.8 | 22.0 | -18.4 |
| Alabama | 6. Grdts | 1.6 | 7.1 | -3.9 |
| Tennessee | 6. Grdts | 0.9 | 5.8 | -4.0 |
| Iowa | 6. Grdts | 0.7 | 8.3 | -7.0 |
| Virginia | 6. Grdts | 0.3 | 4.0 | -3.5 |
| Arkansas | 6. Grdts | -1.2 | 6.8 | -9.2 |
| Georgia | 6. Grdts | -2.1 | 1.8 | -6.0 |
| Connecticut | 6. Grdts | -3.0 | 0.9 | -6.9 |
| Louisiana | 6. Grdts | -3.1 | 2.7 | -9.0 |
| Massachusetts | 6. Grdts | -3.4 | -0.1 | -6.6 |
| North Dakota | 6. Grdts | -3.6 | 21.8 | -29.1 |
| Hawaii | 6. Grdts | -4.4 | 8.2 | -17.0 |
| Wisconsin | 6. Grdts | -4.5 | 1.1 | -10.1 |
| Ohio | 6. Grdts | -4.8 | -1.0 | -8.6 |
| Kansas | 6. Grdts | -5.7 | 2.3 | -13.6 |
| Nebraska | 6. Grdts | -6.4 | 2.7 | -15.5 |
| Michigan | 6. Grdts | -7.0 | -3.7 | -10.3 |
| Mississippi | 6. Grdts | -7.3 | -0.4 | -14.1 |
| New Jersey | 6. Grdts | -7.5 | -4.7 | -10.3 |
| Indiana | 6. Grdts | -7.9 | -3.2 | -12.5 |
| Pennsylvania | 6. Grdts | -7.9 | -5.3 | -10.5 |
| Missouri | 6. Grdts | -9.2 | -4.7 | -13.8 |
| West Virginia | 6. Grdts | -10.0 | -1.9 | -18.0 |
| Kentucky | 6. Grdts | -10.1 | -5.7 | -14.5 |
| Illinois | 6. Grdts | -11.1 | -8.3 | -13.9 |
| New York | 6. Grdts | -11.3 | -9.3 | -13.3 |
| Rhode Island | 6. Grdts | -11.6 | 0.7 | -24.0 |
| Oklahoma | 6. Grdts | -14.2 | -7.3 | -21.1 |
| District of Columbia | 6. Grdts | -16.4 | -3.7 | -29.1 |
| Alaska | 6. Grdts | -43.1 | -19.4 | -66.8 |
| Colorado | 5. BchlrDgr | 16.2 | 20.0 | 12.4 |
| Nevada | 5. BchlrDgr | 15.5 | 21.8 | 9.2 |
| Washington | 5. BchlrDgr | 12.7 | 16.3 | 9.0 |
| Oregon | 5. BchlrDgr | 11.7 | 17.0 | 6.4 |
| Arizona | 5. BchlrDgr | 11.1 | 15.5 | 6.8 |
| Texas | 5. BchlrDgr | 8.1 | 9.5 | 6.7 |
| Florida | 5. BchlrDgr | 6.6 | 8.4 | 4.9 |
| North Carolina | 5. BchlrDgr | 6.6 | 9.5 | 3.6 |
| Maine | 5. BchlrDgr | 6.0 | 14.4 | -2.4 |
| South Carolina | 5. BchlrDgr | 6.0 | 11.0 | 1.0 |
| Tennessee | 5. BchlrDgr | 5.9 | 9.9 | 1.8 |
| Louisiana | 5. BchlrDgr | 3.9 | 8.6 | -0.8 |
| Idaho | 5. BchlrDgr | 3.9 | 12.9 | -5.2 |
| New Hampshire | 5. BchlrDgr | 3.6 | 11.2 | -4.0 |
| Arkansas | 5. BchlrDgr | 3.2 | 8.9 | -2.5 |
| California | 5. BchlrDgr | 3.0 | 4.1 | 2.0 |
| Virginia | 5. BchlrDgr | 1.6 | 4.5 | -1.4 |
| Kentucky | 5. BchlrDgr | 0.8 | 5.3 | -3.7 |
| Georgia | 5. BchlrDgr | 0.7 | 3.6 | -2.1 |
| District of Columbia | 5. BchlrDgr | 0.4 | 12.2 | -11.5 |
| Hawaii | 5. BchlrDgr | -0.3 | 7.0 | -7.7 |
| Maryland | 5. BchlrDgr | -0.8 | 3.4 | -5.1 |
| Delaware | 5. BchlrDgr | -1.0 | 8.2 | -10.1 |
| Minnesota | 5. BchlrDgr | -1.6 | 1.9 | -5.1 |
| Kansas | 5. BchlrDgr | -2.7 | 3.1 | -8.4 |
| Massachusetts | 5. BchlrDgr | -2.8 | -0.2 | -5.4 |
| Illinois | 5. BchlrDgr | -3.9 | -1.7 | -6.0 |
| Nebraska | 5. BchlrDgr | -4.1 | 1.5 | -9.6 |
| Missouri | 5. BchlrDgr | -4.9 | -0.7 | -9.1 |
| Connecticut | 5. BchlrDgr | -5.0 | -0.7 | -9.3 |
| Alabama | 5. BchlrDgr | -5.3 | -0.4 | -10.2 |
| Wyoming | 5. BchlrDgr | -5.3 | 15.0 | -25.6 |
| New York | 5. BchlrDgr | -5.7 | -4.1 | -7.3 |
| South Dakota | 5. BchlrDgr | -5.7 | 4.4 | -15.9 |
| Montana | 5. BchlrDgr | -5.8 | 4.1 | -15.8 |
| Oklahoma | 5. BchlrDgr | -6.7 | -2.2 | -11.1 |
| Michigan | 5. BchlrDgr | -7.0 | -4.5 | -9.4 |
| Ohio | 5. BchlrDgr | -7.3 | -4.6 | -10.0 |
| Pennsylvania | 5. BchlrDgr | -7.4 | -5.3 | -9.5 |
| Indiana | 5. BchlrDgr | -7.6 | -4.5 | -10.6 |
| Wisconsin | 5. BchlrDgr | -8.1 | -4.5 | -11.8 |
| Utah | 5. BchlrDgr | -8.5 | -3.3 | -13.8 |
| New Jersey | 5. BchlrDgr | -10.2 | -8.1 | -12.3 |
| Mississippi | 5. BchlrDgr | -10.5 | -4.2 | -16.9 |
| Iowa | 5. BchlrDgr | -12.8 | -8.1 | -17.5 |
| New Mexico | 5. BchlrDgr | -14.0 | -7.0 | -20.9 |
| West Virginia | 5. BchlrDgr | -14.1 | -7.2 | -20.9 |
| North Dakota | 5. BchlrDgr | -14.9 | -3.2 | -26.6 |
| Rhode Island | 5. BchlrDgr | -19.6 | -11.2 | -27.9 |
| Vermont | 5. BchlrDgr | -25.6 | -13.0 | -38.3 |
| Alaska | 5. BchlrDgr | -48.5 | -29.3 | -67.6 |
| Delaware | 4. AssctDgr | 32.1 | 43.9 | 20.2 |
| Montana | 4. AssctDgr | 15.5 | 30.9 | 0.1 |
| North Dakota | 4. AssctDgr | 13.2 | 26.4 | 0.0 |
| Nevada | 4. AssctDgr | 8.2 | 16.1 | 0.2 |
| Colorado | 4. AssctDgr | 8.0 | 13.9 | 2.2 |
| Idaho | 4. AssctDgr | 7.9 | 16.7 | -0.9 |
| Arizona | 4. AssctDgr | 7.8 | 11.9 | 3.7 |
| Florida | 4. AssctDgr | 7.3 | 9.0 | 5.6 |
| South Carolina | 4. AssctDgr | 7.3 | 12.2 | 2.4 |
| Utah | 4. AssctDgr | 6.3 | 12.5 | 0.2 |
| Oregon | 4. AssctDgr | 6.1 | 11.6 | 0.6 |
| North Carolina | 4. AssctDgr | 5.2 | 8.4 | 1.9 |
| Texas | 4. AssctDgr | 5.0 | 6.9 | 3.1 |
| Kentucky | 4. AssctDgr | 4.4 | 9.5 | -0.7 |
| Maine | 4. AssctDgr | 4.3 | 12.0 | -3.3 |
| Tennessee | 4. AssctDgr | 4.1 | 9.7 | -1.5 |
| Hawaii | 4. AssctDgr | 4.0 | 14.0 | -5.9 |
| Missouri | 4. AssctDgr | 3.3 | 7.8 | -1.1 |
| Nebraska | 4. AssctDgr | 3.2 | 11.0 | -4.7 |
| Alabama | 4. AssctDgr | 2.9 | 7.9 | -2.1 |
| Washington | 4. AssctDgr | 2.6 | 6.4 | -1.3 |
| Wisconsin | 4. AssctDgr | 2.4 | 5.6 | -0.9 |
| South Dakota | 4. AssctDgr | 1.6 | 13.9 | -10.7 |
| Virginia | 4. AssctDgr | 0.9 | 4.4 | -2.7 |
| West Virginia | 4. AssctDgr | 0.8 | 10.5 | -8.8 |
| Iowa | 4. AssctDgr | 0.8 | 5.7 | -4.2 |
| Ohio | 4. AssctDgr | 0.4 | 2.5 | -1.6 |
| Maryland | 4. AssctDgr | 0.3 | 5.5 | -5.0 |
| Massachusetts | 4. AssctDgr | 0.0 | 3.3 | -3.4 |
| Mississippi | 4. AssctDgr | -0.2 | 4.9 | -5.2 |
| Oklahoma | 4. AssctDgr | -0.4 | 4.7 | -5.5 |
| New Hampshire | 4. AssctDgr | -0.9 | 8.1 | -9.9 |
| Indiana | 4. AssctDgr | -1.3 | 2.0 | -4.5 |
| Wyoming | 4. AssctDgr | -1.6 | 21.5 | -24.7 |
| Georgia | 4. AssctDgr | -1.8 | 2.1 | -5.7 |
| Michigan | 4. AssctDgr | -2.0 | 0.1 | -4.1 |
| New Jersey | 4. AssctDgr | -2.7 | 0.7 | -6.0 |
| Louisiana | 4. AssctDgr | -2.7 | 3.2 | -8.6 |
| Minnesota | 4. AssctDgr | -3.7 | 0.3 | -7.7 |
| California | 4. AssctDgr | -4.2 | -3.0 | -5.5 |
| New Mexico | 4. AssctDgr | -4.3 | 2.2 | -10.9 |
| Kansas | 4. AssctDgr | -4.6 | 1.7 | -10.9 |
| Connecticut | 4. AssctDgr | -5.4 | -0.6 | -10.2 |
| Pennsylvania | 4. AssctDgr | -5.5 | -2.7 | -8.4 |
| Arkansas | 4. AssctDgr | -6.3 | -1.0 | -11.6 |
| Illinois | 4. AssctDgr | -8.5 | -5.7 | -11.3 |
| Rhode Island | 4. AssctDgr | -9.1 | 1.3 | -19.6 |
| New York | 4. AssctDgr | -9.8 | -8.3 | -11.3 |
| Vermont | 4. AssctDgr | -23.5 | -9.0 | -38.0 |
| Alaska | 4. AssctDgr | -43.1 | -17.6 | -68.6 |
| District of Columbia | 4. AssctDgr | -68.2 | -29.2 | -107.2 |
| North Dakota | 3. SomeCllg | 20.8 | 32.0 | 9.6 |
| Oregon | 3. SomeCllg | 12.4 | 15.5 | 9.3 |
| Nevada | 3. SomeCllg | 12.1 | 16.6 | 7.7 |
| Colorado | 3. SomeCllg | 10.1 | 14.1 | 6.1 |
| Wyoming | 3. SomeCllg | 8.7 | 20.9 | -3.5 |
| Arizona | 3. SomeCllg | 7.7 | 10.6 | 4.8 |
| Delaware | 3. SomeCllg | 7.4 | 16.3 | -1.5 |
| South Dakota | 3. SomeCllg | 7.2 | 15.5 | -1.0 |
| Idaho | 3. SomeCllg | 6.8 | 12.8 | 0.8 |
| South Carolina | 3. SomeCllg | 5.6 | 9.7 | 1.5 |
| Florida | 3. SomeCllg | 5.4 | 6.9 | 3.9 |
| Arkansas | 3. SomeCllg | 4.8 | 9.0 | 0.6 |
| Utah | 3. SomeCllg | 4.6 | 8.9 | 0.3 |
| Montana | 3. SomeCllg | 4.6 | 12.2 | -3.1 |
| Texas | 3. SomeCllg | 4.4 | 5.7 | 3.1 |
| Vermont | 3. SomeCllg | 3.7 | 13.6 | -6.2 |
| Maine | 3. SomeCllg | 3.5 | 9.5 | -2.6 |
| Georgia | 3. SomeCllg | 3.4 | 6.0 | 0.9 |
| Alabama | 3. SomeCllg | 3.4 | 6.2 | 0.6 |
| Tennessee | 3. SomeCllg | 3.0 | 6.2 | -0.3 |
| New Hampshire | 3. SomeCllg | 2.9 | 9.3 | -3.5 |
| North Carolina | 3. SomeCllg | 2.9 | 5.3 | 0.4 |
| Hawaii | 3. SomeCllg | 2.5 | 10.9 | -5.8 |
| Missouri | 3. SomeCllg | 2.4 | 4.9 | 0.0 |
| Kentucky | 3. SomeCllg | 2.4 | 6.0 | -1.3 |
| Washington | 3. SomeCllg | 1.2 | 3.9 | -1.4 |
| Wisconsin | 3. SomeCllg | 1.2 | 3.7 | -1.4 |
| Nebraska | 3. SomeCllg | 1.2 | 6.8 | -4.4 |
| Virginia | 3. SomeCllg | 0.5 | 3.2 | -2.1 |
| Oklahoma | 3. SomeCllg | 0.2 | 3.5 | -3.1 |
| Iowa | 3. SomeCllg | 0.1 | 3.9 | -3.7 |
| Ohio | 3. SomeCllg | 0.0 | 1.8 | -1.8 |
| Indiana | 3. SomeCllg | -0.1 | 2.8 | -3.0 |
| Kansas | 3. SomeCllg | -0.5 | 3.6 | -4.6 |
| Rhode Island | 3. SomeCllg | -0.8 | 5.0 | -6.7 |
| West Virginia | 3. SomeCllg | -0.9 | 4.3 | -6.2 |
| Louisiana | 3. SomeCllg | -1.1 | 2.6 | -4.9 |
| Mississippi | 3. SomeCllg | -1.7 | 2.6 | -6.1 |
| Michigan | 3. SomeCllg | -2.2 | -0.7 | -3.7 |
| Maryland | 3. SomeCllg | -2.3 | 0.5 | -5.1 |
| Massachusetts | 3. SomeCllg | -2.3 | 0.3 | -4.9 |
| Minnesota | 3. SomeCllg | -2.7 | 0.1 | -5.4 |
| Pennsylvania | 3. SomeCllg | -2.7 | -0.8 | -4.6 |
| New Mexico | 3. SomeCllg | -3.1 | 2.1 | -8.3 |
| Connecticut | 3. SomeCllg | -3.9 | -0.3 | -7.5 |
| California | 3. SomeCllg | -5.6 | -5.0 | -6.3 |
| Illinois | 3. SomeCllg | -6.6 | -4.9 | -8.2 |
| New Jersey | 3. SomeCllg | -7.9 | -5.8 | -9.9 |
| District of Columbia | 3. SomeCllg | -9.4 | 7.1 | -26.0 |
| New York | 3. SomeCllg | -10.8 | -9.5 | -12.1 |
| Alaska | 3. SomeCllg | -47.4 | -33.8 | -61.1 |
| Nevada | 2. HsDgrEqv | 11.2 | 15.4 | 7.1 |
| Idaho | 2. HsDgrEqv | 10.1 | 15.6 | 4.6 |
| Florida | 2. HsDgrEqv | 7.5 | 8.9 | 6.1 |
| Delaware | 2. HsDgrEqv | 7.3 | 13.6 | 1.0 |
| Oregon | 2. HsDgrEqv | 7.2 | 10.2 | 4.2 |
| Arizona | 2. HsDgrEqv | 5.9 | 8.6 | 3.2 |
| New Hampshire | 2. HsDgrEqv | 5.5 | 10.4 | 0.5 |
| Colorado | 2. HsDgrEqv | 5.1 | 8.2 | 2.0 |
| South Carolina | 2. HsDgrEqv | 5.0 | 7.9 | 2.0 |
| Washington | 2. HsDgrEqv | 4.5 | 7.1 | 1.9 |
| Arkansas | 2. HsDgrEqv | 4.1 | 7.4 | 0.8 |
| New Mexico | 2. HsDgrEqv | 3.4 | 7.5 | -0.8 |
| Georgia | 2. HsDgrEqv | 3.3 | 4.9 | 1.8 |
| Utah | 2. HsDgrEqv | 3.3 | 7.2 | -0.6 |
| Texas | 2. HsDgrEqv | 2.8 | 3.9 | 1.7 |
| North Dakota | 2. HsDgrEqv | 2.8 | 16.6 | -11.0 |
| Tennessee | 2. HsDgrEqv | 2.0 | 3.9 | 0.1 |
| North Carolina | 2. HsDgrEqv | 1.9 | 4.1 | -0.2 |
| Nebraska | 2. HsDgrEqv | 1.9 | 6.5 | -2.8 |
| Indiana | 2. HsDgrEqv | 1.6 | 3.2 | 0.0 |
| Iowa | 2. HsDgrEqv | 1.1 | 4.6 | -2.4 |
| Kentucky | 2. HsDgrEqv | 1.0 | 3.4 | -1.4 |
| Louisiana | 2. HsDgrEqv | 1.0 | 3.0 | -1.1 |
| Missouri | 2. HsDgrEqv | 0.9 | 3.1 | -1.2 |
| Virginia | 2. HsDgrEqv | 0.9 | 3.0 | -1.3 |
| Wisconsin | 2. HsDgrEqv | 0.8 | 2.5 | -0.8 |
| Oklahoma | 2. HsDgrEqv | 0.8 | 4.2 | -2.6 |
| Ohio | 2. HsDgrEqv | 0.5 | 1.7 | -0.7 |
| Montana | 2. HsDgrEqv | 0.3 | 7.1 | -6.6 |
| West Virginia | 2. HsDgrEqv | -0.1 | 4.0 | -4.3 |
| Maryland | 2. HsDgrEqv | -0.3 | 2.0 | -2.6 |
| Michigan | 2. HsDgrEqv | -0.5 | 0.9 | -1.9 |
| Pennsylvania | 2. HsDgrEqv | -0.9 | 0.3 | -2.0 |
| Alabama | 2. HsDgrEqv | -0.9 | 1.4 | -3.3 |
| Kansas | 2. HsDgrEqv | -1.3 | 3.2 | -5.7 |
| Maine | 2. HsDgrEqv | -1.3 | 2.7 | -5.4 |
| Mississippi | 2. HsDgrEqv | -1.7 | 1.8 | -5.2 |
| Minnesota | 2. HsDgrEqv | -1.7 | 0.5 | -3.9 |
| Rhode Island | 2. HsDgrEqv | -2.8 | 2.4 | -7.9 |
| Wyoming | 2. HsDgrEqv | -2.8 | 8.7 | -14.3 |
| New Jersey | 2. HsDgrEqv | -3.7 | -2.1 | -5.3 |
| South Dakota | 2. HsDgrEqv | -4.0 | 2.4 | -10.3 |
| Connecticut | 2. HsDgrEqv | -4.7 | -2.3 | -7.2 |
| Vermont | 2. HsDgrEqv | -4.9 | 0.0 | -9.9 |
| California | 2. HsDgrEqv | -5.0 | -4.0 | -5.9 |
| Massachusetts | 2. HsDgrEqv | -5.2 | -3.2 | -7.1 |
| Illinois | 2. HsDgrEqv | -5.2 | -3.7 | -6.7 |
| Hawaii | 2. HsDgrEqv | -7.2 | -0.8 | -13.6 |
| New York | 2. HsDgrEqv | -7.7 | -6.7 | -8.7 |
| District of Columbia | 2. HsDgrEqv | -44.9 | -33.0 | -56.8 |
| Alaska | 2. HsDgrEqv | -73.4 | -61.0 | -85.8 |
| Wyoming | 1. LssHsDgr | 14.6 | 47.5 | -18.3 |
| Delaware | 1. LssHsDgr | 12.4 | 22.4 | 2.3 |
| North Dakota | 1. LssHsDgr | 9.7 | 28.8 | -9.4 |
| South Dakota | 1. LssHsDgr | 9.0 | 27.4 | -9.3 |
| Minnesota | 1. LssHsDgr | 8.8 | 14.4 | 3.1 |
| Oklahoma | 1. LssHsDgr | 8.4 | 13.3 | 3.4 |
| Kansas | 1. LssHsDgr | 7.2 | 14.6 | -0.2 |
| Wisconsin | 1. LssHsDgr | 6.4 | 10.4 | 2.4 |
| Nevada | 1. LssHsDgr | 6.3 | 11.8 | 0.9 |
| Colorado | 1. LssHsDgr | 4.7 | 9.6 | -0.2 |
| Washington | 1. LssHsDgr | 4.5 | 8.4 | 0.6 |
| Georgia | 1. LssHsDgr | 4.3 | 6.7 | 1.9 |
| Oregon | 1. LssHsDgr | 4.2 | 9.2 | -0.7 |
| Michigan | 1. LssHsDgr | 4.0 | 6.6 | 1.4 |
| Tennessee | 1. LssHsDgr | 3.8 | 7.3 | 0.3 |
| Louisiana | 1. LssHsDgr | 3.6 | 6.5 | 0.7 |
| Ohio | 1. LssHsDgr | 3.3 | 6.0 | 0.5 |
| Mississippi | 1. LssHsDgr | 3.2 | 7.9 | -1.5 |
| Pennsylvania | 1. LssHsDgr | 3.2 | 6.2 | 0.2 |
| Texas | 1. LssHsDgr | 2.7 | 3.6 | 1.8 |
| West Virginia | 1. LssHsDgr | 2.6 | 9.5 | -4.2 |
| Indiana | 1. LssHsDgr | 2.6 | 5.7 | -0.6 |
| Rhode Island | 1. LssHsDgr | 2.4 | 11.2 | -6.5 |
| New Mexico | 1. LssHsDgr | 2.4 | 7.5 | -2.8 |
| Kentucky | 1. LssHsDgr | 2.2 | 5.9 | -1.4 |
| Missouri | 1. LssHsDgr | 1.9 | 6.1 | -2.3 |
| Arkansas | 1. LssHsDgr | 1.7 | 7.1 | -3.8 |
| Iowa | 1. LssHsDgr | 1.7 | 10.5 | -7.2 |
| Utah | 1. LssHsDgr | 1.4 | 8.6 | -5.7 |
| Maryland | 1. LssHsDgr | 0.5 | 4.3 | -3.2 |
| Florida | 1. LssHsDgr | 0.0 | 1.9 | -2.0 |
| North Carolina | 1. LssHsDgr | -0.2 | 2.4 | -2.7 |
| Virginia | 1. LssHsDgr | -0.2 | 2.9 | -3.4 |
| Connecticut | 1. LssHsDgr | -0.5 | 4.5 | -5.4 |
| South Carolina | 1. LssHsDgr | -0.8 | 2.4 | -4.1 |
| Arizona | 1. LssHsDgr | -1.1 | 2.1 | -4.2 |
| New Jersey | 1. LssHsDgr | -1.8 | 1.0 | -4.6 |
| Montana | 1. LssHsDgr | -2.0 | 15.1 | -19.0 |
| Nebraska | 1. LssHsDgr | -2.3 | 7.4 | -12.0 |
| California | 1. LssHsDgr | -2.5 | -1.9 | -3.1 |
| Alabama | 1. LssHsDgr | -3.9 | -0.2 | -7.6 |
| New Hampshire | 1. LssHsDgr | -4.0 | 10.3 | -18.2 |
| Massachusetts | 1. LssHsDgr | -5.5 | -1.6 | -9.5 |
| Illinois | 1. LssHsDgr | -7.0 | -4.8 | -9.2 |
| New York | 1. LssHsDgr | -7.3 | -6.0 | -8.6 |
| Idaho | 1. LssHsDgr | -8.7 | 1.7 | -19.1 |
| Vermont | 1. LssHsDgr | -9.8 | 9.3 | -28.9 |
| Hawaii | 1. LssHsDgr | -9.9 | -0.9 | -18.8 |
| Maine | 1. LssHsDgr | -12.4 | -0.8 | -24.0 |
| District of Columbia | 1. LssHsDgr | -29.5 | -14.4 | -44.7 |
| Alaska | 1. LssHsDgr | -117.8 | -88.8 | -146.8 |
Main body here


