Showing posts with label field of study. Show all posts

Tuesday, December 24, 2019

College ScoreCard Earning by Major - 4-Year Public Bachelor

Data used in the project is derived from the DataMaster IPEDS project. Details of the project can be found at: Youtube.com and Tableau Public

Higher education have been touted by many as the ticket to prosperity, especially the higher education industry. But for many years, the industry was not able to provide measurable evidence of the benefit provided by specific higher education institutions. On the surface, people heard of stories and believes elite schools are 'likely' to provide more benefits.

The US Department of Education were on the mission in trying to provide American parents and students measures the were intended to help families in choosing schools that provided good values for their investment in the higher education. The College Score Card data is exactly aimed at that goal.

In the past, the College Score Card, has published salary data by schools. Unfortunately, the data would not distinguish the values of different field of studies. Since institionss have very different mixes of colleges, or field of studies, the published salary data were likely to reflex the composition of the institution instead of the value of the institution.

This year (2019), the November 20's update to the Score Card data, for the first time, were able to provide salary data by the field of studies, granted only the salary earned one year after graduated from college.

While the data is very useful, the web tool provided is a bit difficult for consumer to see the big picture. It is the goal of this article to provide user a different way of using the data.

For beginner, the Field of Study is classified by what we called the CIP code. The CIP code is used to classify degree programs into various categories. There are many CIP codes and, therefore, the categories. Each detailed category were given a 6-digits CIP code. Similar categories are then grouped together and are given a 4-digits CIP code. For now, the published salary data is at the 4-digits code level.

There are several way of using the tools provided below. To see the big picture, we can begin with Figure 1 by selecting the (All) for both the 2-digits and 4-digits CIP codes. This will show the overall salary data provided by ScoreCard dataset. For the histogram, you and see that of all the program data provided by the ScoreCard, there are 1,711 program that will earn their graduates about $27,000 for the first year after graduation. At the high-end, you can see that there are 4 programs that will earn their graduates about $114,000 for the first year.

Once we see the over all picture, we can dive into each of the 2-digits CIP code branches. Let's leave the 4-digits CIP with the (All) selection and just select the 2-digits CIP code one by one. This will allow us to get a general sense of the market value of each discipline.

In the case that if you were looking at a particular school, you can obtained the salary of your school from College Score Card's web site and put it in the context of the Figure 1.

One drawback of the Figure 1 is that it is hard to compare various 2-digits CIPs in order to come up with some extractions. To facilitate that, the author has provide some general observation at the end of the article beginning with Figure 3 below.

Figure 1, the Salary Range
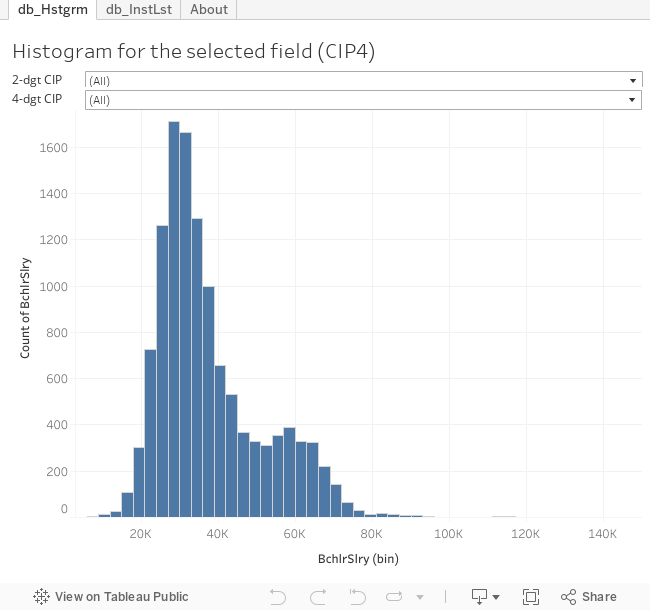
If you were looking at the Figure 1 and were wondering who were those schools that provided high salary earning, you can use the Figure 2 below to find out.

First, you select the 2-digits CIP, and then the 4-digits CIP. You can then use the salary bin dropdown to select the salary. Once you did that, you will see a list of schools that fall inside that salary range.

Figure 2, the List of Institutions

As we all know that STEM is a heated topics in many economic development and higher education discussions. From the salary point of view, the suspicion is that STEM graduates get paid well. However, if we look at Figure 3 carefully, we understand that there are a lot of myth surrounding that perception.

First of all, the original idea of STEM is to identify field, knowledge, or trainings that are essential for the US to stay competitive in the knowledge centered global economics. This idea does not necessarily meet by the real world economics of supply and demands. The other problem of the STEM is the designation of fields. These days, almost any field that can remotely tied to the original idea were given the STEM tag by various 'researchers'. In figure 3, we do take the liberal route that included many 'STEM' fields. Of cause, our purpose is simply to show salaries comparison.

From Figure 3, we can easily see that, in general, engineers got paid well followed by one branch of the health field along with 'information service' and 'engineering technician'. One interesting observed is that the health fields actually broken into two humps - the higher humps are pretty much correspond to the registered nurses and the other hump are much of administrative, nutrition and other services. Looking at other components in the STEM designation, they aren't doing as well. Other components leaded by the mathematician, then the 'physicist chemists' and followed by the social scientist, the second branch of the health field and, then, the biologist.

Figure 3, summary for STEM fields

Liberal Arts and Humanities graduates are constantly been considered the opposites to the STEM graduates. However, as to the first year salary, most liberal arts were paid compatibly to physicist and chemist.

Figure 4, Humanities and Liberal Arts

Besides the STEM and Liberal Arts fields, there are few fields that are well established and worth to take a look at. These are the business, the education, the visual/performance arts, and the agricultural related fields. Comparing to STEM fields, the business graduates got paid relatively well comparable to that of mathematician. The education graduates got paid comparable to that of physicist, followed slightly by the agricultural graduates. Compare to all fields we have discussed, the visual/performance artist probably paid the least, where the peak located.

Figure 5, Some major fields

Figure 6 shows some other fields that have relatively more data (i.e. more inst. provided the training). Within those, Architects doing relatively well.

Figure 6, fields with relatively more data

The rest of fields are shown in Figure 7 and 8. The number of data points presented in the ScoreCard are low - may just because few students are in those fields and the US Education department can have enough data to insure the data is statistically sound.

Figure 7 and 8, fields with relatively less data

=================

Tuesday, November 05, 2013

Doctor's degree by field of study, race, foreign, and gender


The field of choice for US doctor awardees are similar regard less of race. Non-resident alien accounted for almost 30% of the supply for higher education instructors!

Observing of doctoral degree conferred in the United States provided us a unique look into the US higher education system. It provided implications for our future higher education system. For one, the doctors are the main source of future college instructors, and secondly, they are future leaders of our higher education institutions. They are also the main research talent that will continue to move the country forward. Lawyers also play important roles in the social justice of our society, especially in protecting minorities' legal rights.

The CL education center has just released a set of data processing reports based on the IPEDS (Integrated Postsecondary Education Data System) 2011-12 completer survey - the analysis can be found under the section: United State's Doctor Production.

IPEDS survey classifies Doctors into 3 groups: The Research Doctors, the Professional Practice Doctors, and the Other Doctors. For non-legal, and non-medical field, the research doctors are the main source for college instructors. The professional practice doctors are mainly the lawyers, and the medical doctors, but also includes doctors that are mainly prepared for specialized career practices like ...

Total Doctor Degrees Awarded by Field of Study (CIP)

Figure 1, Doctors' field of study for each race (click to view the whole chart)
The major field/CIP of interested are list in Table 1 below.

Table 1, major field of interest for each race (multiple and unknown race not displayed)
CIPTitleNativeAsianPIBlackHispanicWhiteAlien
11Computer and Info. Sci.0.3%0.8%0.4%0.2%0.5%4.2%
13Education8.6%1.9%15.9%6.6%5.8%3.4%
14Engineering1.6%3.7%1.4%2.0%2.4%24.8%
22Legal Prof. and Studies37.5%21.2%29.1%38.8%30.5%5.7%
26Bio and Biomedical Sci.3.1%4.1%2.6%3.7%4.0%11.2%
40Physical Sciences1.3%1.5%0.9%1.5%2.4%11.3%
42Psychology3.5%1.7%3.9%5.5%4.0%1.8%
45Social Science1.1%1.0%1.3%1.5%1.7%5.9%
51Health Professions related36.3%58.7%32.3%33.3%39.4%10.1%


Figure 1 and Table 1 revealed that, for US citizen, almost all races are favoring Legal, and Health Professions roughly equally, except Asian Pacific Islander are skewed more toward Health Professions. Beside the point made above, in general, all races exhibit similar field-of-study pattern. The major disparities in the chart come from the non-residence alien, where the dominated field is the engineering. Their domination on physical science and biology is also noticeable.


Total Doctor Degrees Awarded by Race
Table 2, total doctor degree awarded by race
NativeAsianPIBlackHispanicWhiteAlienUnknownMult.Rc
0.5%9.5%6.1%5.5%58.8%11.5%7.3%0.7%

Total Research Doctors Awarded by Race
Table 3, total research doctors awarded by race
NativeAsianPIBlackHispanicWhiteAlienUnknownMult.Rc
0.4%5.3%6.3%4.1%49.2%27.3%6.8%0.6%

The research doctor degree, which mainly removed the lawyers and medical doctors from the total doctor count, awarded to non-residence alien comprise a whooping 27% of all the research doctor degree awarded. Research doctors are the major supply of teachers for our higher education system.

Table 4, research doctors awarded by fields(CIP) and by race
CIPTitleNativeAsianPIBlackHispanicWhiteAlienUnknownMult.Rc
1Agriculture and Operation0.7%2.5%1.3%4.1%34.5%52.0%4.5%0.4%
3Nature Resource and Conservation0.4%3.4%2.5%3.4%56.7%27.4%5.6%0.5%
4Architecture0.0%17.8%4.0%3.5%29.2%37.1%6.4%2.0%
5Area, Ethnic, Cultural, Gender Studies2.2%8.6%11.9%5.0%44.2%16.9%10.4%0.7%
9Communication, Journalism0.7%2.6%5.7%2.1%56.3%25.3%6.9%0.3%
10Communication Technologies0.0%0.0%0.0%0.0%0.0%100.0%0.0%0.0%
11Computer and Info Sci.0.2%8.3%2.0%1.2%33.0%50.4%4.7%0.2%
12Personal and Culinary Services


13Education0.8%3.1%16.6%6.1%58.3%7.0%7.5%0.6%
14Engineering0.2%7.0%1.7%2.2%28.2%56.2%4.2%0.4%
15Engineering Technologies0.0%5.5%1.8%1.8%49.1%34.5%7.3%0.0%
16Foreign Languages, Literatures0.1%3.6%1.7%6.6%47.0%32.4%8.4%0.3%
19Family, Consumer Sci.0.3%3.4%9.1%2.2%57.2%25.3%2.2%0.3%
22Legal Prof. and studies0.0%1.6%0.5%2.1%11.0%77.0%7.9%0.0%
23English, Literature0.4%3.4%4.0%3.8%70.8%8.5%7.9%1.1%
24Liberal Arts, Sci. General Studies0.0%4.5%3.4%1.1%56.8%12.5%20.5%1.1%
25Library Sci.0.0%2.0%2.0%2.0%48.0%42.0%4.0%0.0%
26Bio. Biomedical Sci.0.3%8.2%3.3%4.3%49.8%27.2%6.3%0.6%
27Math. And Statistics0.3%5.7%1.4%1.8%39.4%46.5%4.7%0.1%
28Military Sci. Leadership


29Military Tech.0.0%0.0%0.0%0.0%83.3%16.7%0.0%0.0%
30Interdisciplinary Studies0.5%5.3%10.0%4.8%52.3%20.2%5.6%1.4%
31Recreation, Leisure Studies0.4%1.2%7.0%2.1%62.8%24.8%1.2%0.4%
32Basic, Remedial Education


33Citizenship Activities


34Health Knowledge and Skill


35Social Skills


36Leisure, Recreational Activities


37Self-Improvement


38Philosophy and Religious Studies0.1%2.6%5.4%2.9%62.5%18.1%7.5%1.0%
39Theology, Religious Vocations0.0%4.7%10.8%3.3%61.0%12.6%7.3%0.2%
40Physical Sciences0.2%4.6%1.7%2.6%43.7%40.6%6.2%0.5%
41Science Tech.0.0%33.3%0.0%0.0%66.7%0.0%0.0%0.0%
42Psychology0.6%4.7%6.7%8.0%63.1%6.9%9.0%0.9%
43Protective Services0.0%3.8%11.5%3.1%63.4%12.2%5.3%0.8%
44Public Administration0.4%4.7%15.1%5.3%47.2%17.0%9.7%0.7%
45Social Science0.3%4.5%3.8%3.9%47.4%32.2%7.2%0.7%
46Construction Trades


47Mechanic, Repair Tech.


48Precision Production


49Materials Transportation


50Performing Arts0.4%6.1%1.9%3.5%57.8%22.1%7.8%0.5%
51Health Professions0.3%5.9%7.7%3.3%60.9%13.3%8.1%0.5%
52Business, Marketing0.4%5.2%12.5%4.4%41.2%26.0%10.2%0.2%
53Secondary Diplomas


54History0.5%2.6%4.5%4.5%64.7%12.3%9.6%1.2%
60Residency Programs


Figure 4 further breaks down the research doctors by field of study (CIP) and by race. The engineering stand out. 56% of the engineering doctor degrees were awarded to non-resident alien. Other non-resident alien heavy fields include Agriculture(52%),
Architecture(37%), Computer Sci.(50%), Engineering Tech(35%), Foreign Languages(32%), Library Sci.(42%), Math. And Statistics(47%), Physical Sciences(41%), Social Science(32%). All of these fields displayed a non-resident alien rate that is higher than the 27.3%, the average rate held by non-resident alien.

Total Research Doctors Awarded by Gender
Men(51%) and women(49%) held roughly the same share of all the research doctor degrees awarded by US institutions. The lowest fields with women recipients are Military Tech(17%), Theology(19%), Computer(20%), and Engineering(22%).

Professional Practice Doctor Degrees Awarded by Gender
In this category, men(53%) held a slightly larger share in the Legal Profession while women(57%) hold larger share in the Medical Doctor field.