Showing posts with label Private. Show all posts

Sunday, April 07, 2019

Online Courses Search - Private College Programs IPEDS 2016

Begin

Note: Information provided in this article is obtained from the project 'DataMaster -IPEDS'. Detail of the project can be found in Youtube, and EdPond articles.

Using Panels provided by this tool, readers can locate online courses offered by the private colleges of the United States. The project is hosted at the Tableau Public. For online program offered by the public colleges of the United States, please see this tools/application.

Through the years, based on US Education Department's IPEDS (Integrated Postsecondary Education System) survey, the per-cent of students involved in distance classes have increased in almost all sectors of 2-year and 4-year colleges. The recent trend from year 2012 to 2016 can be visualized in my previous article:
"IPEDS College Data - Online/Distance Education Enrollment Trend".

Even though not directly related, private institutions in the United States also provide opportunities for students to obtain degrees through distance education 'completely'. Based on IPEDS definition, a 'Distance Education Program' is a program for which all the required coursework for program completion is able to be completed via distance education courses, in which the instructional content is delivered exclusively via distance education. IPEDS' definition for 'Distance Education Course' do reserve the possibilities that students maybe asked to physically participate in some activities like testing, orientation, or academic support services. This can mean that, in reality, some of the degrees listed in this articles may not be completely feasible remotely.

Anyway, it is the intention of this article to provide a list of disciplines and colleges that were reported to IPEDS as 'Distance Education Program'. Students are cautioned to check the details with institutions before committed to work toward the degrees.

Given all the above, let's now look at the overall picture of the 'Distance Education Program' offered by United States' private institutions.

Based on the IPEDS data, there are total 14,909 distance education programs offered by United States' private institutions, 4-year or 2-year. Of these programs, 3,853 are in the Associate or Certificate level. At the Bachelor-degree level, there are 5,181 programs. At higher degree levels, there are 1,017, 4,453, 378, and 27 programs respectively for post-bachelor, master, post-master, and doctor degree.

Information about these distance education programs can be examined via the following interactive panels.

Panel 1 - State Category
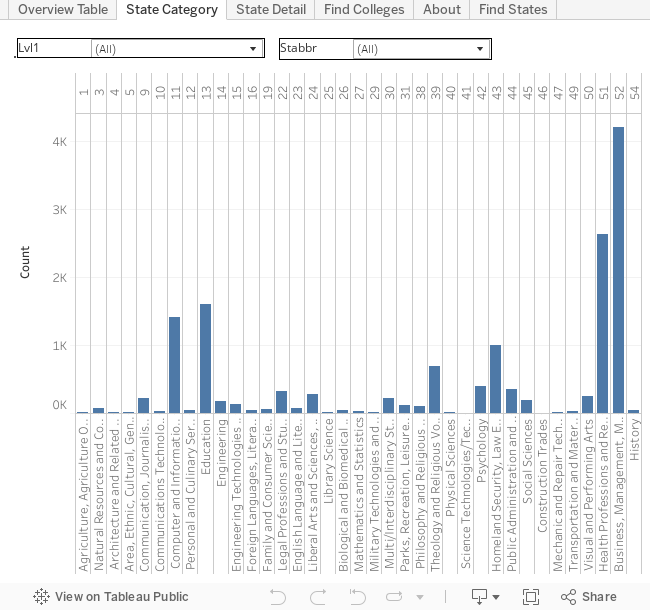
In panel 1, by selecting the state of interest and the degree level, user can exam the number of (distance education) programs offered in each discipline branch, depicted by the two-digit CIP (Classification of Instructional Program) code. By selecting all levels and all states, it can be observed that most programs are offered at the category of CIP 52, the Business, followed by CIP 51, the Health, and CIP 13, the Education branch. Summing over all states, at the Associate and Certificate level, the CIP 11, the Computer, ranked 3rd instead of CIP 13, the Education. At the bachelor level, CIP 24, the Libral Art, comes before CIP 13, and ranked as the 3rd. At the post bachelor and master level, CIP 13 is way ahead of Business (CIP 52) and Health (CIP 51), where they are of similar magnitude and traded each other with levels. For the doctor level, there are only 3 CIPs: 51, 13, and 44 (social services).

The state summary in Panel 1 is good if you are interested in in-state degrees. However, an online program being an online program is the freedom to enrolled from anywhere. In this case, searching from the program of interested maybe the way to go. Panel 2 shows exactly that.

Panel 2 - Find States
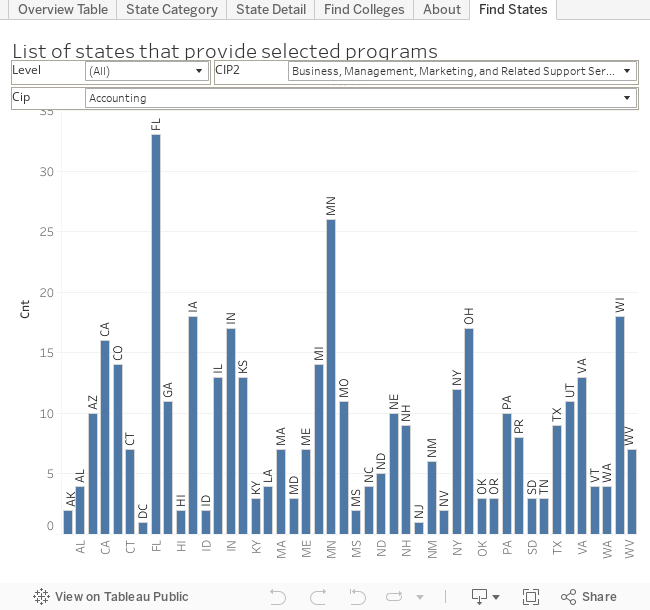
In Panel 2, reader can select the degree level:
    Assoicate and Certificates (DeCrtAssct)
    Bachelor (DeBchlr)
    Post Bachelor Certificates (DePstBchlr)
    Master (DeMstr)
    Post Master Certificates (DePstMstr)
    Doctor (DeDctr)
, the two-digit cip category, and, then, the cip program title. This allows reader to see from which states the selected programs are available. With this information, reader can continue to find out which college/institution offering the particular program.
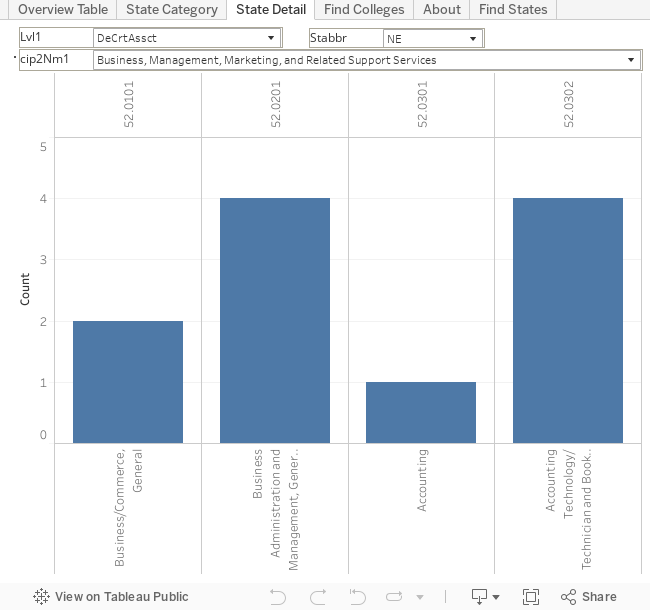
Panel 3 - State Detail

With this above panel, reader can find specific programs offered at the 6-digit CIP level - example are the Accounting training in the Business field (CIP 52).

Panel 4 - Find college
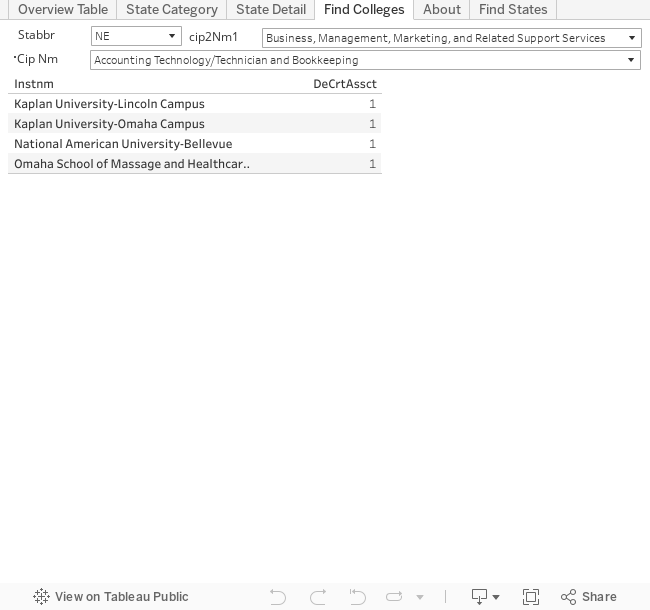
With Panel 4, reader can narrow their selection to the desired programs and the colleges that offered the programs.

Panel 5 - Overview Table

Panel 5 allows readers to compare program offered by each state. By selecting the desired states, readers can view program offerings side by side. For policy makers and higher education leaders, these data can be important in making decisions on what program to provide for the benefits of the society.

End

Monday, April 23, 2012

US College Graduation Rates by Race by State - 2010 IPEDS

Interact with the author through EduStats - We value your input.
Related Articles:
US College Graduation Rate by State for 2009-10 graduates
College Graduation Rates by State - 2009 Ranking
Data release: College Graduation Rates by State for 2008-09 graduates

Race in United States is a much debated topic. Tying race to discrimination is a sequel of historical events. The subsistence of the racism is continually disputed. The data revealed here is too limited to settle the disagreement. But we do hope the data can pointed to the weak spot in our education system and, hopefully, solutions with emphasis on personal obligation can be developed. In author's opinion, some of today's approach in improving minorities' education attainment is overreaching and is themselves racial biased and undermined the important principle of personal responsibility. Services should be made available to all regardless of race. It takes responsible person to seek helps. Which race group actually uses these services is not a racial issue.

Opinion aside, objective view of the data is definitely in order.

This analysis is based on the data released earlier by the CL Higher Education Center. The analysis dis-regards the non-residence alien. The US total also excludes US minor islands and territories.

The College Graduation Rates by Race for the US states are shown in table 1 while the table 2 shows the same data with the inclusion of US minor islands and territories with differences highlighted. The difference for Asian are mainly caused by the inclusion of the Guam and the Northern Mariana Islands. The changes for Hispanic are the effect of including the Puerto Rico. The rest of the analysis would focus on the US states and Washington DC. Changes from last year's number are included in the parenthesis.

Compare with last year, the public-four-year, public-two-year and the private-not-for-profit-four-year sectors are seeing improvements. Basically, the graduation rate for all races in these sectors are either improved or stay the same. Viewing the data with respect to race, White-non-hispanic improved in all sectors while minorities showing mixed result.

Table 1 - US states - including DC
SectorNativeAsianBlackHispanicWhiteTotal


Public 4Yr35%65%36%(+1)44%57%(+1)54%
NProfit 4Yr(+3)49%(+1)76%44%(+2)59%67%(+1)65%
Profit 4Yr(-3)38%(+4)46%31%(-2)41%(+5)45%(+3)41%
Public 2Yr17%(+1)26%12%16%23%20%
NProfit 2Yr(-8)15%51%(-2)44%(-1)46%(+1)56%(-1)50%
Profit 2Yr(+1)59%(-3)69%(+2)49%(+2)65%(+2)65%(+1)60%
Overall32%57%32%40%50%47%

Table 2 - With US minor islands and territories**
SectorNativeAsianBlackHispanicWhiteTotal


Public 4Yr35%64%36%43%57%53%
NProfit 4Yr(+3)49%(+1)76%44%(+2)45%67%63%
Profit 4Yr(-3)38%(+4)46%31%(-2)39%(+5)45%(+2)40%
Public 2Yr17%25%12%(+1)17%23%20%
NProfit 2Yr(-8)15%51%(-2)44%(-1)62%(+1)56%(-2)53%
Profit 2Yr(+1)59%(-3)69%(+2)49%(+3)64%(+2)65%(+1)60%
Overall32%56%32%40%50%46%


Fig. 1 shows the US average graduation rates by race by sector. In general, White and Asian stand out in the public-four-year, public-two-year and private-not-for-profit-tour-year institutions. In other sectors, White and Asian college graduation rates are more comparable to other races. Overall, the public two year sector shows the lowest college graduation rates for all races (except the Natives). Within each sector, the Black usually exhibit the lowest rate except at the public four year sector, where the Native American show the lowest college graduation rate. It is also interesting to see that the private not-for-profit sectors have higher college graduation rates than their public counter parts.

Fig. 1 - US average graduation rates for each sector by race

Figure 2. present the same information as in Figure 1 except grouped by each race. Within all races, the private for-profit two year sector demonstrates high rates, only within White and Asian it seconds to the private not-for-profit four year sector. It is also remarkable to see how similar the rates within each race relative to each other - public-two-years are, in general the lowest. The private-not-for-profit-four-year and the private-for-profit-two-year are usually have the highest rate.

Fig. 2 - US average college graduation rates for each race by sector


== The following have not been updated to 2010 data yet =======
Figure 3 is an un-traditional display of a set of histogram for Asian. Each histogram/curve show the number of states at each graduation rate for a given sector. For example, there are 12 states that have college graduation rates for Asian greater than 55% and less than 60% for the public four year sector/curve while there are 9 states have college graduation rates greater than 30% and less than 35% for the private for-profit four year sector/curve.

Figure 3 demonstrates clearly that, for Asian, the average college graduation rates for each sector are representative except for the not-for-profit two year sector, where most of the states have a rate of 0% and rates are spread out without some kind of concentration or locality.

Fig. 3 - College graduation rate for Asian by sector


Figure 4 displayed similar information as in Figure 3 except it is for the Black. Even though the US average college graduation rate for the private not-for-profit four year sector is comparable to other sectors for Black, figure 4 shows that the rate varies a lot in regard to different states.

Fig. 4 - College graduation rate for Black by sector


Figure 5, 6 and 7 illustrate the same kind of information for Hispanic, Native American and White.

Fig. 5 - College graduation rate for Hispanic by sector


Fig. 6 - College graduation rate for Native American by sector


Fig. 7 - College graduation rate for White by sector


Figure 8 modeled after previous figures to display the college graduations rates for each race in the public four your sector. This chart clearly shows that the White and Asian are comparable except that there are some states where Asian exhibits higher rates.

Fig. 8 - College graduation rates for public four year sector by race


Figure 9 to 13 show the similar information as in Figure 8 for each sector.

Fig. 9 - College graduation rates for private not-for-profit four year sector by race


Fig. 10 - College graduation rates for private for-profit four year sector by race


Figure 11 is an very interested one. For one, this is the only one that all races are having good localities. Second of all, the White seems to be the one that is doing better even though the US average college going rates for public two year sector clearly show that the Asian is doing better than the White. The mystery is solved when dig deeper into the data. The data show that the high average college graduation rate for Asian in the public two year sector is caused by a single state with high Asian public two year sector enrollment, the California, which has a college graduation rate of 36% for Asian. This means that even though on average, Asian is doing good in public two year sector, it is not a Nation wide fact. It is also worth to note that the only state with meaningful high college graduation rates for the Native American is Wisconsin which enrolled 199 students. The other two states only enroll a total of 7 Native Americans. The other high rate state worth noting is the South Dakota, which post a rate of 64% for White.

Fig. 11 - College graduation rates for public two year sector by race


Figure 12 demonstrates that value of this kind of charts, where the meaning of average college graduation rates for private not-for-profit two year sector have very limited value.

Fig. 12 - College graduation rates for private not-for-profit two year sector by race


Fig. 13 - College graduation rates for private for-profit two year sector by race


Friday, February 26, 2010

Release of Graduation Rate for Private High School By US states

CL Higher Education Center

CL Higher Education Center just released the graduation rate for private high school by state.

The analysis is based on the 2005 and 2007 Private School Survey (PSS) that is managed by the National Center of Education Statistics (NCES) of the Department of Education (USDE). The overall graduation rate for private high school is 98.3 for 2004-05 graduates and 98.0 for 2006-07 graduates. The data presented will also be used for estimating the total high school graduates of a state, which can then be used to estimate the college going rate for each state when combined with data from the Integrated Postsecondary Education Data System (IPEDS).