Showing posts with label trend. Show all posts

Monday, November 12, 2018

Online Education Statistics (IPEDS Enrollment Trend)


If you are looking for online program offered by United States' public colleges, please use this online search tool/application to find colleges offering them.

With higher education continuing to be considered the footstep to reaching personal economic sufficiency, the demand for postsecondary education continues to grow. With the growing demands, governments, states, private companies, and institutions were working hard to capitalize and meet the demands. Distance education, with its nature, overcome several traditional higher education limitations.

Basic statistics of the distance education in United States were published in the 'Digest of Education Statistics' by National Center for Education Statistics (NCES). The most recent summary table published can be found here.

The table presents national level data with sector break down using the preliminary 2016 IPEDS (Integrated Postsecondary Education Data System) data published back in Feb. 2018. The table shows two years (2015 and 2016) of data, which are of limited use in showing the trends.

The purpose of this article is to fill the gaps and present some trend data using the 'data master' data system developed by the author. Information about the data system can be found at the ITTidbit, the Youtube, and the Vimeo.

For this article, I will be dealing with the National level data only as opposed to State level data, which will be dealt with in separate articles. The data presented here would be an enhancement to the basic statistics published by NCES in terms of the years of coverage, the break down of categories, and the revision of the data. The data used are revisions published by IPEDS as of Oct. 24, 2018.

The general observations of the data are:
  1. For degree-seeking students (include graduate students), which is the majority of undergraduates, the fraction of students taking online classes continue to grow.
  2. For 4-year schools, public and private not-for-profit schools, the number of students taking online classes are continue to grow.
  3. For 4-year degree seeking, private for-profit schools show high degree use of distance education - 65-80% vs. 15-30% for public and private not-for profit schools.

DC+50States of US; 4-year Inst.; Undergraduate Total; Any Online Course;

  Head Count : (4-year; Under)
The chart above presents the enrollment headcount for undergraduate students that taking any online course in 4-year institutions located in the DC or the 50 states of United States. The blue line represents the public 4-year institutions while the orange line represents the private not-for-profit 4-year institutions. The green line represents the private for profit 4-year institutions.

  Percent of Undergraduate Enrollment : (4-year; Under)
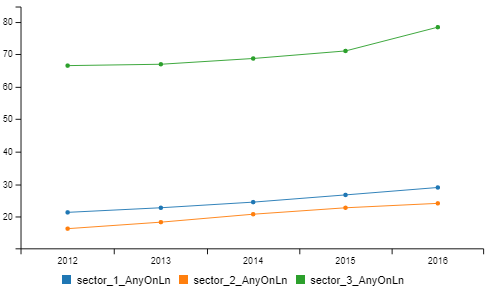
Head count is important, but it does not tell the whole story. Percent of total enrollment provides a different level of details. As shown in this above chart, the private for-profit institution (green line) actually utilized the distance education to higher degree while the public 4-year institution (blue line) comes next even though it has more students as shown in previous chart.

DC+50States of US; 4-year Inst.; Undergraduate Degree Seeking; Any Online Course;

  Head Count : (4-year; Under; Degree Seeking)

The chart above presents the enrollment headcount for undergraduate degree seeking students that taking any online course in 4-year institutions located in the DC or the 50 states of United States. The blue line represents the public 4-year institutions while the orange line represents the private not-for-profit 4-year institutions. The green line represents the private for profit 4-year institutions.

  Percent of Undergraduate Degree Seeking Student : (4-year)

DC+50States of US; 4-year Inst.; Undergraduate non-Degree Seeking; Any Online Course;

  Head Count : (4-year; Under; non-degree seeking)

  Percent of Undergraduate non-Degree Seeking students: (4-year)
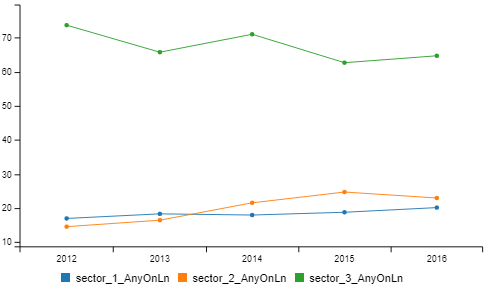


DC+50States of US; 4-year Inst.; Graduate; Any Online Course;

  Head Count : (4-year; Graduate students)
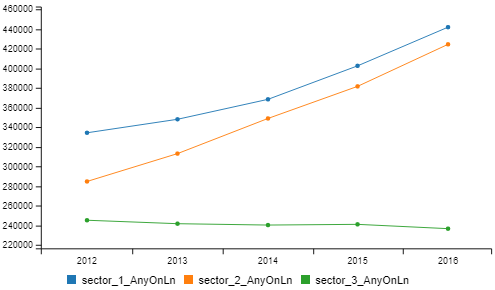
The chart above presents the enrollment headcount for graduate students that taking any online course in 4-year institutions located in the DC or the 50 states of United States. The blue line represents the public 4-year institutions while the orange line represents the private not-for-profit 4-year institutions. The green line represents the private for profit 4-year institutions.

  Percent of Graduate enrollment : (4-year)


DC+50States of US; 2-year Inst.; enroll total; Any Online Course;

  Head Count : (2-year; enroll total)

The chart above presents the enrollment headcount for undergraduate students that taking any online course in 2-year institutions located in the DC or the 50 states of United States. The blue line represents the public 2-year institutions while the orange line represents the private not-for-profit 2-year institutions. The green line represents the private for profit 2-year institutions. One thing stand out in this chart is that the public 2-year institutions have much more students than that of private 2-year institutions.

   Percent of enrollment total : (2-year)


DC+50States of US; 2-year Inst.; degree seeking; Any Online Course;

  Head Count : (2-year; degree seeking)
Again, comparing with previous chart, it shows that majority undergraduate students are degree seeking students. For data concerning non-degree seeking students, please see the following section.

   Percent of degree seeking students : (2-year)
   
DC+50States of US; 2-year Inst.; non-degree seeking; Any Online Course;

  Head Count : (2-year; non-degree seeking)

   Percent of non-degree seeking students : (2-year)


=============

Data published by NCES Digest of Education Statistics:
  • Compare with private, public institution show less (%) distance students. Also less (%) exclusive distance students.
  • Compare with graduate, undergraduate show less (%) exclusive students but more none-exclusive students.
  • For profits shows much more exclusive students (4-year) - I assuming 2-year of smaller scale and not enthusiasm about distance ed.
  • 2 year, in general, more exclusive.
  • public has more in-state than out-of-state; private, the reverse is true. 
Data in general show the growing trend on distance/on-line education.
For public institution, because of the mission of educate state residents, public institution, in general, enrolls state residence and, therefore, less students from out of state and less students taking distance education courses from out of state.

It, however, can be a strategy move for public institution to accept out of state students if the capacity is allowed and to recover the cost of development.

It is also interested to see if it is possible to relate fields distribution to the number of students taking online courses since, likely, some fields are more suitable for online presentation.

From policy point of view, it may not be easy to make arguments with simple head count distribution since there are many factors in deciding what is an appropriate % of online courses.

Distance education, by definition, allow students to take courses away from the campus and, in that way, reduces spaces requirement. On the other hand, the requirement for staff's time may not reduced - staff will be transferred to work on tutorial duties. In a sense, you increase the quality in liue of reduce cost.

Serve the public - student body - the whole state.
How privates contributes.

Institution size - related to distance ed. - Serve each other institution.


 here

Friday, February 02, 2018

Educational Attainment and State Income - ACS PUMS

Original Article

Summary goes here!

Educational Attainment is a measure that often used to gauge the intellectual power of a region. As a nation, it was concerned that the United State could fall behind in global economic competition and this caused various movement and initiatives try to increase the number of college graduates in the United States. While working on other projects, the author suspects the linkage between educational attainment and a state's income. This is the author's first attempt in linking a state's per capita income to the educational attainment of the state.

This article using the American Community Survey's PUMS data released by US Census Bureau to compare the educational attainment of each state. The advantage of the PUMS data is its ability to produce statistic results that is not directly available from pre-prepared tables offered by Census' website. In our case, we are interested in the educational attainment of adult population with age between 22 and 64 years old in each state.

For ranking, we will rank states with several educational attainment configurations.  See the following tables for detail.

As to the relation between per capita income and educational attainment, I will just show three quick charts at this point - it deserves closer analysis later.
* The per capita income data obtained from List of U.S. states by income on Feb. 2, 2018. The income data is derived from 2014-10 ACS data. * In general, per capita income concerns people of age 15 or older which isn't really match the age range we used in calculating the educational attainment. But assuming that the income contributed from age 15 to 22 are limited and that the adding of age 65 to 99 do change the fact much (say, the retirement income of graduate degree holder still higher than that of bachelor degree holder), the result could still be representative. A finer investigation of the situation will follow.  

For Bachelor-and-above degree holder


For Graduate degree holder


For Doctor and Professional degree holder
Of these three charts, the District of Columbia (the right most point) shows a very high income when comparing to other states. All of the three charts show high correlation values of 0.91, 0.86, and 0.79 respectively. Without District of Columbia, it brings these correlation coefficients closer. This basically reflect the fact that in two of these charts, the District of Columbia is out of line with other states. Observing the charts carefully, you can conclude that at District of Columbia, there are higher percent of master, doctor and professionals degree holders and that is why the income is high. However, these degree holders did not contribute, proportionately, as much as those in other states.
* Correlation is also done for associate degree and above and it shows lower correlation values than that of bachelor and above with or without District of Columbia.

==========
Ranking states by percent of bachelor-and-above degree holder
Stt Nm2010 Rank2011 Rank2015 Rank2016 Rank2010 %2011 %2015 %2016 %
District of Columbia111152.5%53.2%57.4%58.3%
Massachusetts222241.6%41.7%43.0%43.7%
Connecticut333337.5%37.8%39.3%39.8%
New Jersey444437.3%37.4%38.9%39.5%
Maryland555537.2%37.3%38.7%39.0%
Colorado666636.5%36.7%37.9%38.3%
Virginia777735.4%35.7%37.4%37.9%
Vermont8881034.8%35.5%36.6%36.1%
New York9109834.5%34.8%36.2%36.6%
New Hampshire10910934.5%34.8%36.1%36.6%
Minnesota1111111133.5%33.7%35.4%35.6%
Rhode Island1212131332.6%32.9%33.2%33.8%
Illinois1313121232.6%32.8%34.2%34.7%
Washington1414141431.2%31.3%32.6%33.3%
Kansas1515151631.1%31.2%31.9%32.3%
North Dakota1618222230.3%29.7%29.9%30.3%
California1716181930.1%30.1%31.0%31.5%
Hawaii1817191830.1%29.9%30.9%31.5%
Nebraska1919161529.8%29.7%31.7%32.4%
Oregon2020212129.3%29.4%30.4%31.1%
Pennsylvania2121171729.3%29.4%31.0%31.7%
Delaware2223202028.9%28.5%30.8%31.4%
Montana2322282928.8%29.2%28.7%28.9%
Utah2424232428.7%28.4%29.5%29.9%
Georgia2525262728.0%28.2%29.1%29.6%
Wisconsin2627252327.6%27.6%29.3%29.9%
Maine2726242627.6%28.0%29.5%29.7%
Iowa2828292827.4%27.4%28.7%29.2%
North Carolina2929272527.3%27.4%29.1%29.8%
South Dakota3031323127.2%27.3%27.7%28.5%
Missouri3130303027.0%27.3%28.5%28.8%
Michigan3232313226.7%26.7%27.9%28.3%
Florida3333353526.6%26.4%27.3%27.7%
Alaska3434363626.4%26.2%27.0%27.5%
Arizona3537373726.1%25.8%26.7%27.1%
Texas3636343426.0%26.2%27.4%27.9%
Ohio3735333326.0%26.2%27.4%28.0%
South Carolina3839393824.8%24.7%25.8%26.6%
New Mexico3940434324.7%24.4%24.6%24.8%
Idaho4038414224.7%25.0%25.3%25.5%
Indiana4141424124.1%24.2%25.3%25.9%
Tennessee4243383924.0%24.1%26.0%26.5%
Wyoming4342404023.6%24.2%25.7%25.9%
Oklahoma4444444423.3%23.4%24.5%24.7%
Alabama4545454522.9%22.9%23.9%24.4%
Kentucky4646464621.8%21.7%23.2%23.7%
Nevada4747484821.6%21.6%22.0%22.2%
Louisiana4848474721.5%21.6%22.8%23.2%
Mississippi4950505120.1%20.1%20.6%20.8%
Arkansas5049494920.1%20.4%21.8%22.1%
West Virginia5151515018.8%19.2%20.5%20.9%
==========
Ranking states by percent of graduate degree holder
Stt Nm2010 Rank2011 Rank2015 Rank2016 Rank2010 %2011 %2015 %2016 %
District of Columbia111126.5%26.7%29.8%30.6%
Massachusetts222216.4%16.5%17.3%17.6%
Maryland333315.6%15.6%16.4%16.6%
Connecticut444415.2%15.4%16.0%16.2%
Virginia555513.7%13.8%14.8%15.1%
New York666613.7%13.8%14.3%14.4%
New Jersey777713.2%13.2%13.7%14.0%
Vermont889912.3%12.5%12.7%12.8%
Colorado998812.0%12.1%12.7%13.0%
Rhode Island1011121211.7%11.8%12.0%12.2%
New Hampshire1110101011.6%11.9%12.6%12.6%
Illinois1212111111.4%11.4%12.1%12.3%
Delaware1313131310.9%10.7%11.4%11.6%
Washington1414151510.4%10.5%11.0%11.2%
Pennsylvania1515141410.3%10.4%11.1%11.3%
California1616171910.2%10.2%10.6%10.8%
Minnesota1717161610.0%10.1%10.9%11.0%
Oregon181818179.9%10.0%10.5%10.8%
New Mexico192021219.8%9.7%9.9%10.0%
Kansas201919189.8%9.9%10.5%10.8%
Michigan212223229.4%9.5%9.8%10.0%
Georgia222120209.4%9.5%10.1%10.4%
Hawaii232426269.4%9.3%9.4%9.6%
Missouri242322239.3%9.4%9.9%9.9%
Ohio252625278.9%9.0%9.4%9.6%
Alaska262524288.8%9.1%9.5%9.4%
Maine272729308.8%9.0%9.2%9.3%
Arizona282932318.8%8.6%9.0%9.2%
Utah293130298.6%8.5%9.0%9.3%
Nebraska303228248.6%8.5%9.3%9.7%
Wisconsin312831328.6%8.7%9.0%9.1%
Florida323033338.6%8.6%8.9%9.0%
North Carolina333327258.4%8.5%9.4%9.7%
Kentucky343534348.2%8.1%8.8%8.9%
Montana353437398.2%8.3%8.5%8.5%
South Carolina363739378.1%8.0%8.4%8.7%
Texas373636368.0%8.1%8.6%8.8%
Tennessee383835357.8%7.9%8.7%8.8%
Indiana394042427.8%7.7%8.0%8.1%
Iowa403938387.7%7.8%8.4%8.6%
Alabama414141407.6%7.7%8.1%8.3%
Wyoming424240417.4%7.6%8.1%8.2%
South Dakota434448457.2%7.1%7.0%7.4%
Idaho444343447.1%7.3%7.5%7.6%
North Dakota454746476.9%6.8%7.2%7.3%
Oklahoma464545466.9%6.9%7.3%7.4%
West Virginia474644436.8%6.8%7.4%7.7%
Nevada484851516.8%6.7%6.9%6.9%
Mississippi494950506.6%6.6%6.9%7.1%
Louisiana505049486.5%6.4%7.0%7.2%
Arkansas515147496.2%6.3%7.0%7.1%
* Data in the table are labeled with the data release year. For example, the '2016' actually cover the data collected between 2012 and 2016. The value is to be interpreted as the average between those years.

Observing the above table, it shows every single state listed, including District of Columbia, is making progresses in improving its educational attainment level. Ranking with the percent difference between the first and last available educational attainment level, it shows that District of Columbia leading the improvement with a change of 4.14% followed by Virginia, North Carolina, Massachusetts, and Nebraska. Rounding up the top ten, here comes the Maryland, Tennessee, Pennsylvania, Georgia, and Minnesota.
============
Ranking states by percent of Doctor or Professional degree holder
Stt Nm2010 Rank2011 Rank2015 Rank2016 Rank2010 %2011 %2015 %2016 %
District of Columbia111110.9%10.8%11.0%11.2%
Maryland22334.9%4.9%4.9%4.9%
Massachusetts33224.8%4.8%5.0%5.1%
Connecticut44444.1%4.2%4.3%4.3%
New York55563.8%3.8%3.9%3.9%
Virginia66673.6%3.6%3.8%3.8%
New Jersey77783.6%3.6%3.7%3.7%
Vermont89853.3%3.3%3.6%3.9%
California9810103.3%3.3%3.3%3.4%
Rhode Island1010993.2%3.2%3.4%3.6%
Hawaii111518173.2%3.0%3.0%3.1%
Colorado121111113.1%3.1%3.3%3.3%
Pennsylvania131414143.1%3.0%3.1%3.2%
Delaware141615153.1%3.0%3.1%3.1%
Oregon151316163.1%3.1%3.0%3.1%
Illinois161213133.1%3.1%3.2%3.2%
New Mexico171822223.0%3.0%2.8%2.8%
Washington181717183.0%3.0%3.0%3.0%
Minnesota191912123.0%3.0%3.2%3.3%
New Hampshire202019202.8%2.8%3.0%2.9%
Nebraska212326232.7%2.6%2.7%2.7%
Florida222225262.7%2.6%2.7%2.7%
Georgia232121192.7%2.7%2.9%3.0%
Kansas242524242.6%2.6%2.7%2.7%
Alaska252420212.6%2.6%2.9%2.8%
Missouri262627272.5%2.6%2.6%2.6%
Utah273031312.5%2.4%2.5%2.6%
Montana282737302.5%2.6%2.4%2.6%
Michigan292832332.5%2.5%2.5%2.5%
Ohio302933352.4%2.4%2.5%2.5%
Arizona313636362.4%2.3%2.4%2.5%
Wisconsin323538372.4%2.4%2.4%2.5%
Iowa333328282.4%2.4%2.6%2.6%
North Carolina343430292.4%2.4%2.5%2.6%
Maine353123252.4%2.4%2.7%2.7%
Tennessee363229342.4%2.4%2.5%2.5%
Kentucky373835382.3%2.3%2.4%2.5%
Texas383940392.3%2.3%2.3%2.3%
Idaho393741412.3%2.3%2.2%2.3%
South Dakota404047422.2%2.2%2.0%2.3%
Indiana414344452.2%2.1%2.1%2.1%
Louisiana424442402.2%2.1%2.2%2.3%
Wyoming434134322.1%2.2%2.5%2.5%
North Dakota444239442.1%2.1%2.3%2.2%
South Carolina454746462.1%2.1%2.1%2.1%
Alabama464643432.1%2.1%2.2%2.2%
Nevada474548492.1%2.1%2.0%2.0%
Oklahoma485045472.0%2.0%2.1%2.1%
Mississippi494951512.0%2.0%1.9%1.9%
West Virginia504849481.9%2.0%2.0%2.0%
Arkansas515150501.8%1.7%1.9%1.9%
============