As a state higher education stakeholder, it will be interesting to know where your college going students went for colleges. Knowing that information can help making policies to either keep students in the state or make the best usage of state resources. The National IPEDS (Integrated Postsecondary Education Data System) survey provided you exactly these information.
For beginner, let's understand how those data were collected. Basically, the IPEDS survey will asked each college/institution to provide information about which State their first-time degree seeking students come from. At the same time, they also asked colleges to separate those students into two groups: One for those graduated from higher school within one year of college attendance and the other for those high school students that waited longer than one year after graduating before enrolled in a college.
By building a data system that hosting these data at the national level, it is possible to see, for a given State, where their college going students went for colleges. Info on a system that provids the data for this article/application and is built to handle IPEDS data at the national level can be found at 'the IT tidbit blog'
with related tutorial/demonstration video posted at: Youtube.com.
This article/application will provide you the knowledge and tools on how to find the migration information at the state level. For detailed information down to the college/institution level, please see the following youtube videos:
College data(Enrollment) States your students come from -IPEDS migration and
IPEDS Nebraska Enrollment Migration College Data
The first video exams which states Nebraska's college students came from and to which institution these students went. The second video shows to which state or institution Nebraska's students went.
For this article, the application is hosted at the Tableau Public and is concerned about state level analysis only. Let's begin with the out-migration first. The out-migration provides reader/user the information about where your college going students went for colleges. Fig. 1 displays exactly that information for students just graduated from high school that attend colleges within 12 months of their graduation.
Figure 1 - Out Migration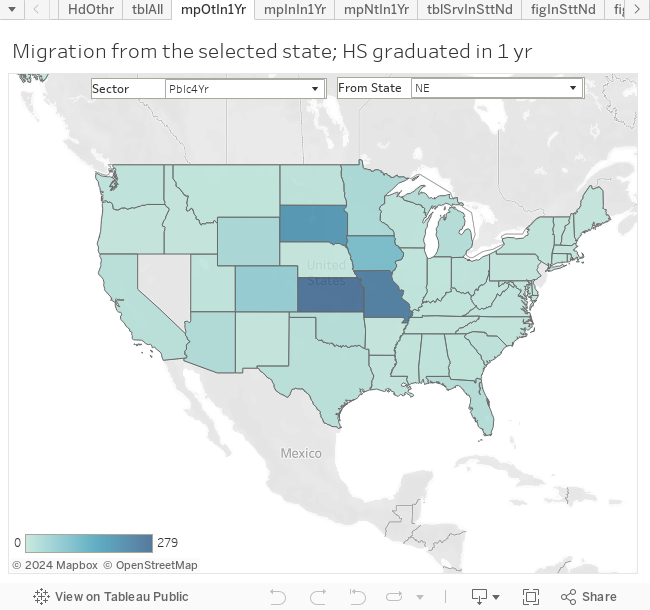
In Fig. 1, if you select public 4 year institution as the sector (Pblc4Yr) and select Nebraska (NE) as the 'From state', you can see Nebraska is sending 279 students to the neighboring state of Kansas (KS).
To get an overall picture, Fig. 2 below provides a way to see the percentage of college goers that are attending the in-state colleges.
Figure 2 - % College Goers Attend In-State Colleges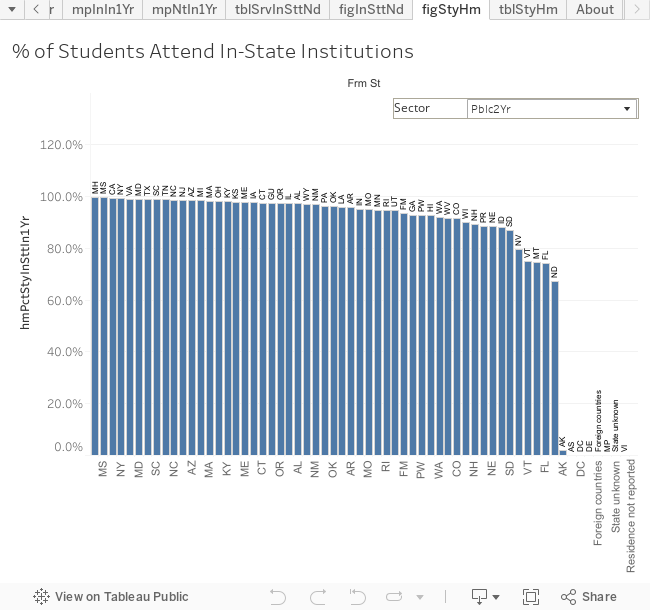
By setting the sector to public-2-year (Pblc2Yr) in Fig. 2, we can observe that for most States, the in-state attendance is around 100% and which is understandable since community colleges were intended to serve local communities. Few exceptions do exist: AK (Alaska), DC (District of Columbia, and DE (Delaware). For Alaska, there is a single public 2 year college: Ilisagvik College. For DC and DE, there is none.
Next, let's exam the number of students that migrated/moved to a particular State. This can be done with the Fig. 3
Figure 3 - In Migration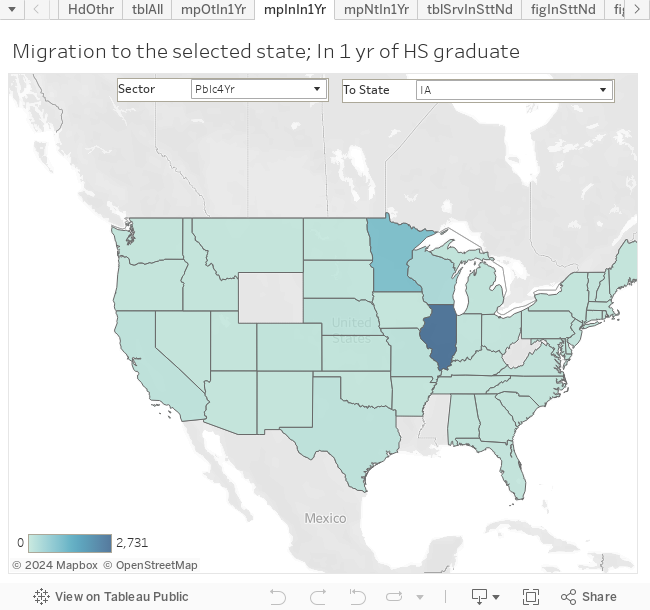
In the case of Fig. 3, if we set the sector to public 4 year(Pblc4Yr) and the 'To state' to IA (Iowa), we notice that there are 2,731 students that left Illinois (IL) and enrolled in Iowa (IA) colleges/institutions.
The next question the readers may have might be... So.. In the Net, if Nebraska lose or gain students from, say, Iowa (IA)? This is exactly what the Fig. 4 can show you.
Figure 4 - Net In-Migration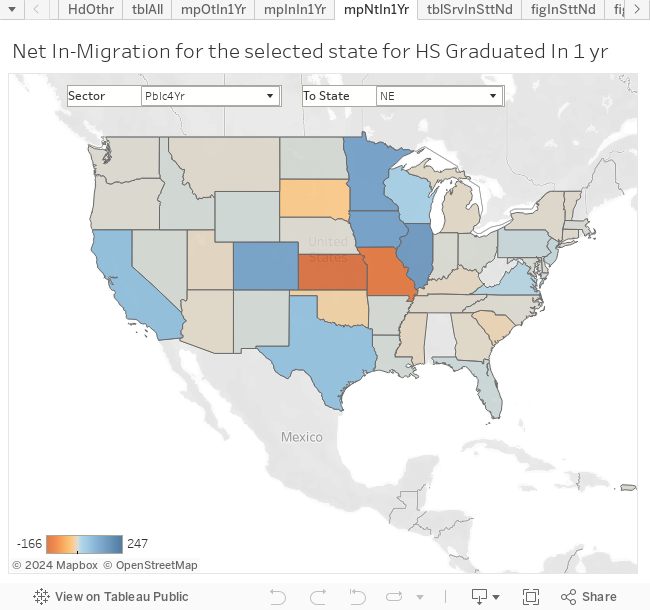
As shown with Fig. 4, Nebraska (NE), in the case of public 4 year (Pblc4Yr), actually gain 137 students from Iowa (IA).
All of the cases about, we are concentrated on students that attend colleges within one year of them graduated from the high schools. Part of the reason is that these are the majority of the students and, also, these are what policy maker may have more influences on.
The next question you might wondering is: if a state do intend to retain all of their college goers, do the state has enough 'space/enrollment-spot' to host all their college goers. There might be other ways to address this question. However, with the data at hand, we intended to answer this question with the Table 1 below.
Table 1 - Serve In-State Needs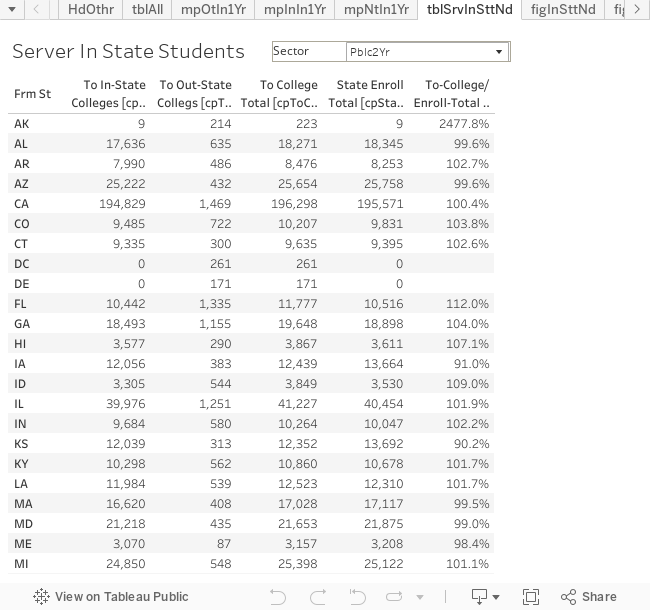
In Table 1, we listed few columns. The second, and the third columns listed college goers that went to in-state, and out-state colleges, while the fourth column provide the total college goers. The fifth column provides the total number of students enrolled in all colleges in the given State, regardless if those students are coming from in-state or out-of-state. We use this column as a measure of the state's enrollment capacity, i.e. the number of students a state's colleges can enroll. By taking the ratio between the college goer and the state capacity, we can see if a state can absorb all its college goers.
By setting the sector in Table 1 to public 4 year (Pblc4Yr), we can observ that Distric of Columbia (DC) simply do not have enough public-4-year institutions to serve its students. State of Illinois is in a similar situation. Fig. 5 below, ranked states based on this ratio from low to high.
Figure 5 - Ranking of Service In-State Needs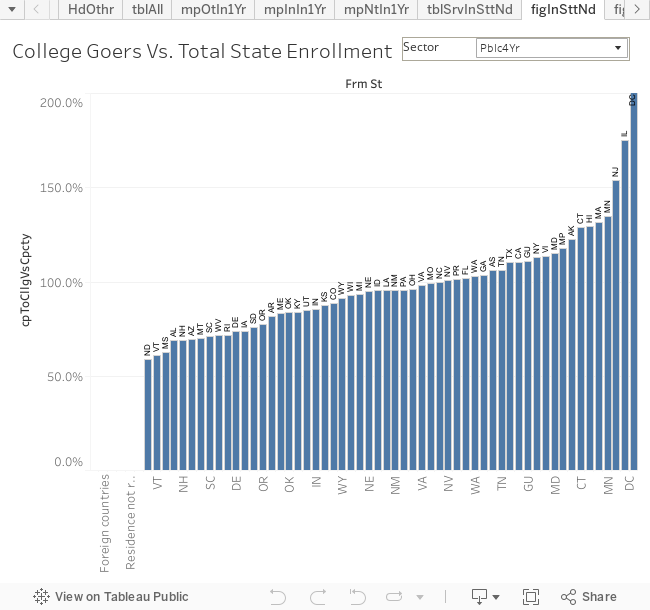
As a side note concerning the Illinois, it was observed in the youtube video: 'College data(Enrollment) States your students come from -IPEDS migration' that Nebraska observed considerable out-of-state students from Illinois. It is now obvious that, not just Nebraska, but there aught be few other States that observe similar phenomena, especially those surrounding Illinois.
Reader should also be cautioned that the In-State-Needs Served ratio should be used carefully. There could have states that most of their students are only interested in 2-year colleges. In that case, there is no need for a lot of 4-year institutions to fulfill the In-State-Needs for 4-year institutions. So, the capacity is relevent to the needs, not the absolute count.
For the convenience of the reader, a table is presented below for the public-4-year sector.
Table 2 - Serving In-State Needs (IPEDS Migration public-4-year institution)| From State | Total College Goers | In-State Capacity | Goers/Capacity |
|---|---|---|---|
| DC | 1,516 | 467 | 324.6% |
| IL | 39,168 | 22,390 | 174.9% |
| NJ | 32,665 | 21,232 | 153.8% |
| MN | 21,944 | 16,304 | 134.6% |
| MA | 20,936 | 15,907 | 131.6% |
| HI | 3,996 | 3,093 | 129.2% |
| CT | 12,323 | 9,568 | 128.8% |
| AK | 3,388 | 2,767 | 122.4% |
| MD | 18,407 | 15,971 | 115.3% |
| NY | 57,896 | 51,273 | 112.9% |
| CA | 144,800 | 131,418 | 110.2% |
| TX | 99,923 | 90,772 | 110.1% |
| TN | 21,144 | 19,904 | 106.2% |
| GA | 51,083 | 49,313 | 103.6% |
| WA | 32,171 | 31,221 | 103.0% |
| FL | 110,114 | 108,130 | 101.8% |
| NV | 13,399 | 13,325 | 100.6% |
| NC | 32,768 | 32,879 | 99.7% |
| MO | 19,353 | 19,466 | 99.4% |
| VA | 31,698 | 32,322 | 98.1% |
| OH | 48,482 | 50,605 | 95.8% |
| NM | 6,789 | 7,097 | 95.7% |
| PA | 43,129 | 45,061 | 95.7% |
| LA | 20,700 | 21,658 | 95.6% |
| ID | 5,787 | 6,065 | 95.4% |
| NE | 8,213 | 8,647 | 95.0% |
| MI | 44,122 | 47,305 | 93.3% |
| WI | 27,428 | 29,610 | 92.6% |
| WY | 1,298 | 1,423 | 91.2% |
| CO | 24,449 | 27,624 | 88.5% |
| KS | 11,032 | 12,580 | 87.7% |
| IN | 29,044 | 33,919 | 85.6% |
| UT | 16,053 | 18,890 | 85.0% |
| KY | 15,624 | 18,643 | 83.8% |
| OK | 14,369 | 17,148 | 83.8% |
| ME | 3,678 | 4,407 | 83.5% |
| AR | 12,053 | 14,771 | 81.6% |
| OR | 8,820 | 11,408 | 77.3% |
| SD | 3,914 | 5,158 | 75.9% |
| DE | 5,942 | 8,075 | 73.6% |
| IA | 9,654 | 13,113 | 73.6% |
| RI | 3,136 | 4,380 | 71.6% |
| WV | 7,851 | 10,967 | 71.6% |
| SC | 13,253 | 18,700 | 70.9% |
| MT | 4,436 | 6,354 | 69.8% |
| AZ | 16,763 | 24,049 | 69.7% |
| NH | 3,567 | 5,155 | 69.2% |
| AL | 17,191 | 25,020 | 68.7% |
| MS | 7,268 | 11,594 | 62.7% |
| VT | 1,930 | 3,164 | 61.0% |
| ND | 3,610 | 6,105 | 59.1% |
| AS | 415 | 392 | 105.9% |
| FM | 17 | 0 | 0.0% |
| GU | 495 | 446 | 111.0% |
| MH | 4 | 0 | 0.0% |
| MP | 360 | 305 | 118.0% |
| PR | 12,651 | 12,477 | 101.4% |
| PW | 13 | 0 | 0.0% |
| VI | 384 | 338 | 113.6% |
| Foreign countries | 41,069 | 0 | 0.0% |
| State unknown | 5,237 | 0 | 0.0% |
| Residence not reported | 3,717 | 0 | 0.0% |


