Showing posts with label migration. Show all posts

Monday, April 15, 2019

Find Where Students Went To Colleges? IPEDS Migration Enrollment

As a state higher education stakeholder, it will be interesting to know where your college going students went for colleges. Knowing that information can help making policies to either keep students in the state or make the best usage of state resources. The National IPEDS (Integrated Postsecondary Education Data System) survey provided you exactly these information.

For beginner, let's understand how those data were collected. Basically, the IPEDS survey will asked each college/institution to provide information about which State their first-time degree seeking students come from. At the same time, they also asked colleges to separate those students into two groups: One for those graduated from higher school within one year of college attendance and the other for those high school students that waited longer than one year after graduating before enrolled in a college.

By building a data system that hosting these data at the national level, it is possible to see, for a given State, where their college going students went for colleges. Info on a system that provids the data for this article/application and is built to handle IPEDS data at the national level can be found at 'the IT tidbit blog'
with related tutorial/demonstration video posted at: Youtube.com.

This article/application will provide you the knowledge and tools on how to find the migration information at the state level. For detailed information down to the college/institution level, please see the following youtube videos:
College data(Enrollment) States your students come from -IPEDS migration and
IPEDS Nebraska Enrollment Migration College Data
The first video exams which states Nebraska's college students came from and to which institution these students went. The second video shows to which state or institution Nebraska's students went.

For this article, the application is hosted at the Tableau Public and is concerned about state level analysis only. Let's begin with the out-migration first. The out-migration provides reader/user the information about where your college going students went for colleges. Fig. 1 displays exactly that information for students just graduated from high school that attend colleges within 12 months of their graduation.

Figure 1 - Out Migration
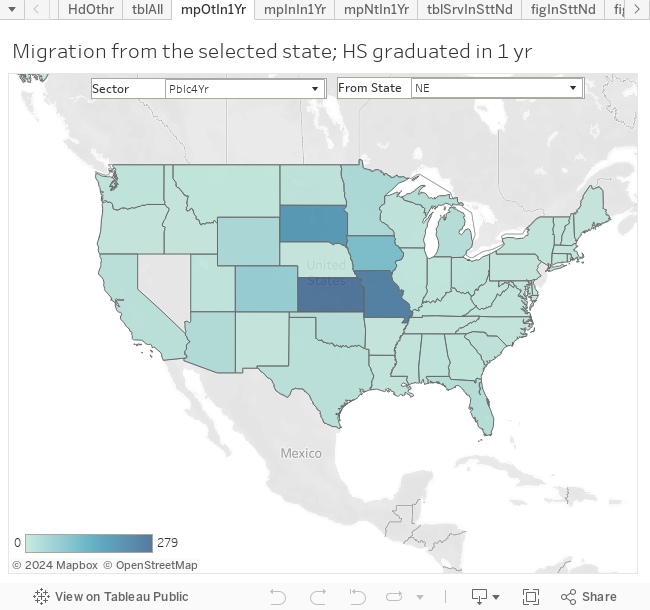
In Fig. 1, if you select public 4 year institution as the sector (Pblc4Yr) and select Nebraska (NE) as the 'From state', you can see Nebraska is sending 279 students to the neighboring state of Kansas (KS).

To get an overall picture, Fig. 2 below provides a way to see the percentage of college goers that are attending the in-state colleges.

Figure 2 - % College Goers Attend In-State Colleges
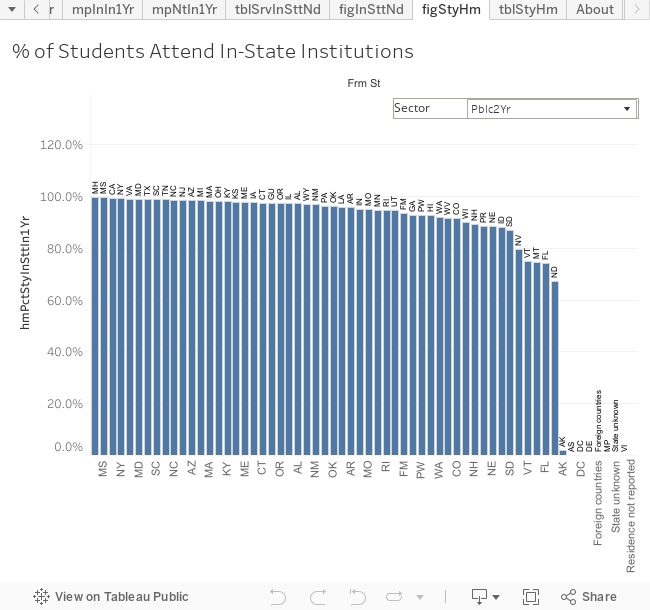
By setting the sector to public-2-year (Pblc2Yr) in Fig. 2, we can observe that for most States, the in-state attendance is around 100% and which is understandable since community colleges were intended to serve local communities. Few exceptions do exist: AK (Alaska), DC (District of Columbia, and DE (Delaware). For Alaska, there is a single public 2 year college: Ilisagvik College. For DC and DE, there is none.

Next, let's exam the number of students that migrated/moved to a particular State. This can be done with the Fig. 3

Figure 3 - In Migration
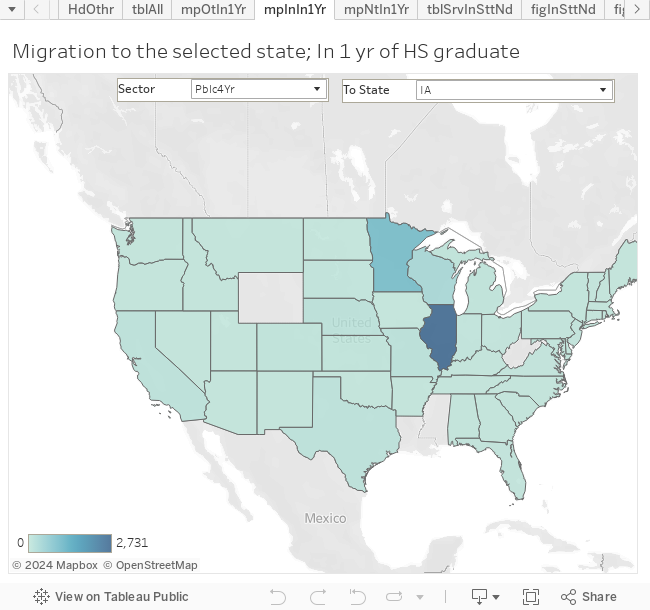
In the case of Fig. 3, if we set the sector to public 4 year(Pblc4Yr) and the 'To state' to IA (Iowa), we notice that there are 2,731 students that left Illinois (IL) and enrolled in Iowa (IA) colleges/institutions.

The next question the readers may have might be... So.. In the Net, if Nebraska lose or gain students from, say, Iowa (IA)? This is exactly what the Fig. 4 can show you.

Figure 4 - Net In-Migration
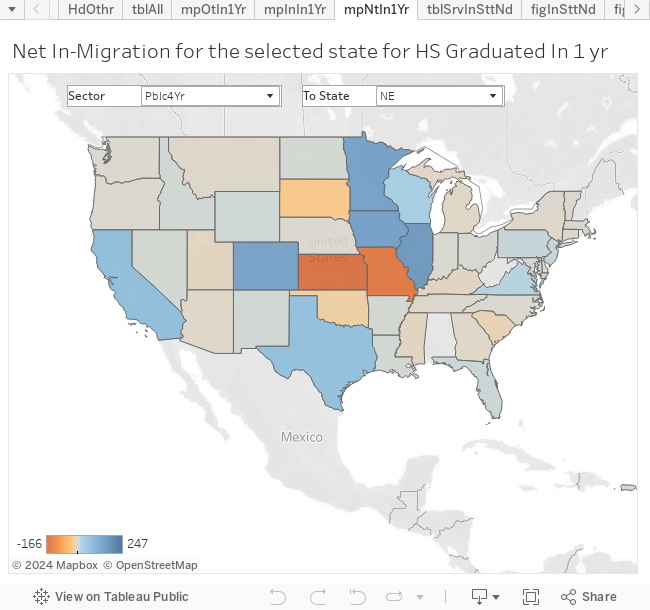
As shown with Fig. 4, Nebraska (NE), in the case of public 4 year (Pblc4Yr), actually gain 137 students from Iowa (IA).

All of the cases about, we are concentrated on students that attend colleges within one year of them graduated from the high schools. Part of the reason is that these are the majority of the students and, also, these are what policy maker may have more influences on.

The next question you might wondering is: if a state do intend to retain all of their college goers, do the state has enough 'space/enrollment-spot' to host all their college goers. There might be other ways to address this question. However, with the data at hand, we intended to answer this question with the Table 1 below.

Table 1 - Serve In-State Needs
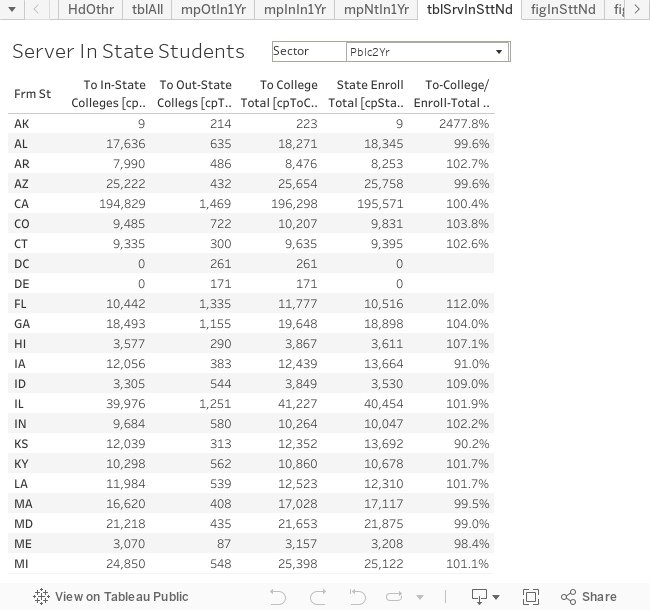
In Table 1, we listed few columns. The second, and the third columns listed college goers that went to in-state, and out-state colleges, while the fourth column provide the total college goers. The fifth column provides the total number of students enrolled in all colleges in the given State, regardless if those students are coming from in-state or out-of-state. We use this column as a measure of the state's enrollment capacity, i.e. the number of students a state's colleges can enroll. By taking the ratio between the college goer and the state capacity, we can see if a state can absorb all its college goers.

By setting the sector in Table 1 to public 4 year (Pblc4Yr), we can observ that Distric of Columbia (DC) simply do not have enough public-4-year institutions to serve its students. State of Illinois is in a similar situation. Fig. 5 below, ranked states based on this ratio from low to high.

Figure 5 - Ranking of Service In-State Needs
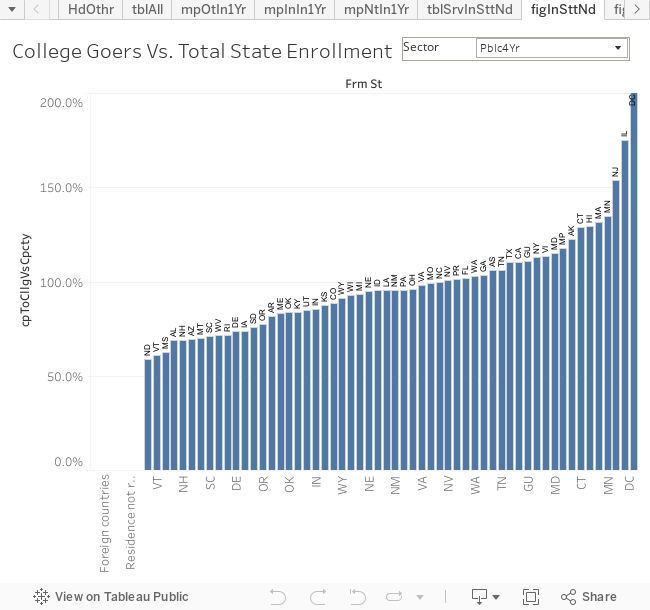
As a side note concerning the Illinois, it was observed in the youtube video: 'College data(Enrollment) States your students come from -IPEDS migration' that Nebraska observed considerable out-of-state students from Illinois. It is now obvious that, not just Nebraska, but there aught be few other States that observe similar phenomena, especially those surrounding Illinois.

Reader should also be cautioned that the In-State-Needs Served ratio should be used carefully. There could have states that most of their students are only interested in 2-year colleges. In that case, there is no need for a lot of 4-year institutions to fulfill the In-State-Needs for 4-year institutions. So, the capacity is relevent to the needs, not the absolute count.

For the convenience of the reader, a table is presented below for the public-4-year sector.

Table 2 - Serving In-State Needs (IPEDS Migration public-4-year institution)
From StateTotal College GoersIn-State CapacityGoers/Capacity
DC1,516467324.6%
IL39,16822,390174.9%
NJ32,66521,232153.8%
MN21,94416,304134.6%
MA20,93615,907131.6%
HI3,9963,093129.2%
CT12,3239,568128.8%
AK3,3882,767122.4%
MD18,40715,971115.3%
NY57,89651,273112.9%
CA144,800131,418110.2%
TX99,92390,772110.1%
TN21,14419,904106.2%
GA51,08349,313103.6%
WA32,17131,221103.0%
FL110,114108,130101.8%
NV13,39913,325100.6%
NC32,76832,87999.7%
MO19,35319,46699.4%
VA31,69832,32298.1%
OH48,48250,60595.8%
NM6,7897,09795.7%
PA43,12945,06195.7%
LA20,70021,65895.6%
ID5,7876,06595.4%
NE8,2138,64795.0%
MI44,12247,30593.3%
WI27,42829,61092.6%
WY1,2981,42391.2%
CO24,44927,62488.5%
KS11,03212,58087.7%
IN29,04433,91985.6%
UT16,05318,89085.0%
KY15,62418,64383.8%
OK14,36917,14883.8%
ME3,6784,40783.5%
AR12,05314,77181.6%
OR8,82011,40877.3%
SD3,9145,15875.9%
DE5,9428,07573.6%
IA9,65413,11373.6%
RI3,1364,38071.6%
WV7,85110,96771.6%
SC13,25318,70070.9%
MT4,4366,35469.8%
AZ16,76324,04969.7%
NH3,5675,15569.2%
AL17,19125,02068.7%
MS7,26811,59462.7%
VT1,9303,16461.0%
ND3,6106,10559.1%
AS415392105.9%
FM1700.0%
GU495446111.0%
MH400.0%
MP360305118.0%
PR12,65112,477101.4%
PW1300.0%
VI384338113.6%
Foreign countries41,06900.0%
State unknown5,23700.0%
Residence not reported3,71700.0%

Sunday, January 28, 2018

Brain Drain - Ranking and Analysis with 2016 ACS PUMS

Original Article

Brain Drain Migration with 2016-12 ACS PUMS data!

This is a data update to my previous article Brain Drain - Ranking and Analysis with 2015 ACS data, which reports brain drain analysis based on the 2015 5-year ACS PUMS data. This article presents the same kind of information based on the 2016 5-year ACS PUMS data. For terms used in the analysis, please referring to the aforementioned ACS 2015 article.

As with previous article, the presentation is hosted at Tableau's public web portal here.

Tables presented in my previous article is updated below.

Net (in) Migration per 1000 22-64 years old population
StateEd. Attainmentper 1000 RsdUpperLower
Washington6. Grdts2.42.81.9
Colorado6. Grdts1.52.20.8
Montana6. Grdts1.53.00.0
Delaware6. Grdts1.52.90.0
Oregon6. Grdts1.21.90.5
New Hampshire6. Grdts1.12.5-0.2
South Carolina6. Grdts1.11.60.7
Texas6. Grdts1.01.10.8
Utah6. Grdts0.91.70.1
Nevada6. Grdts0.91.60.2
Arizona6. Grdts0.81.30.3
Vermont6. Grdts0.83.3-1.8
North Carolina6. Grdts0.71.20.3
Idaho6. Grdts0.71.7-0.3
Maine6. Grdts0.61.8-0.5
California6. Grdts0.60.80.4
Florida6. Grdts0.60.80.3
New Mexico6. Grdts0.41.4-0.5
Maryland6. Grdts0.41.0-0.2
Minnesota6. Grdts0.40.9-0.2
South Dakota6. Grdts0.31.5-1.0
Wyoming6. Grdts0.11.8-1.5
Alabama6. Grdts0.10.6-0.3
Tennessee6. Grdts0.10.5-0.3
Iowa6. Grdts0.10.7-0.6
Virginia6. Grdts0.00.6-0.5
Arkansas6. Grdts-0.10.5-0.7
Georgia6. Grdts-0.20.2-0.6
Louisiana6. Grdts-0.20.2-0.6
North Dakota6. Grdts-0.31.6-2.1
Wisconsin6. Grdts-0.40.1-0.9
Hawaii6. Grdts-0.40.8-1.6
Ohio6. Grdts-0.5-0.1-0.8
Connecticut6. Grdts-0.50.2-1.1
Mississippi6. Grdts-0.50.0-1.0
Massachusetts6. Grdts-0.60.0-1.2
Kansas6. Grdts-0.60.2-1.5
Nebraska6. Grdts-0.60.3-1.5
Indiana6. Grdts-0.6-0.3-1.0
Michigan6. Grdts-0.7-0.4-1.0
West Virginia6. Grdts-0.8-0.1-1.4
Pennsylvania6. Grdts-0.9-0.6-1.2
Kentucky6. Grdts-0.9-0.5-1.3
Missouri6. Grdts-0.9-0.5-1.4
New Jersey6. Grdts-1.0-0.7-1.4
Oklahoma6. Grdts-1.1-0.5-1.6
Illinois6. Grdts-1.4-1.0-1.7
Rhode Island6. Grdts-1.40.1-2.9
New York6. Grdts-1.6-1.3-1.9
Alaska6. Grdts-4.1-1.8-6.3
District of Columbia6. Grdts-5.0-1.1-8.9
Colorado5. BchlrDgr4.15.13.1
Washington5. BchlrDgr2.83.62.0
Oregon5. BchlrDgr2.43.41.3
Nevada5. BchlrDgr2.43.31.4
Arizona5. BchlrDgr2.02.81.2
Texas5. BchlrDgr1.51.81.3
North Carolina5. BchlrDgr1.31.90.7
Florida5. BchlrDgr1.21.60.9
Maine5. BchlrDgr1.22.9-0.5
South Carolina5. BchlrDgr1.12.00.2
Tennessee5. BchlrDgr1.01.80.3
New Hampshire5. BchlrDgr0.92.7-1.0
Idaho5. BchlrDgr0.72.3-0.9
California5. BchlrDgr0.60.90.4
Louisiana5. BchlrDgr0.61.4-0.1
Arkansas5. BchlrDgr0.51.3-0.4
Virginia5. BchlrDgr0.41.0-0.3
Georgia5. BchlrDgr0.10.7-0.4
Kentucky5. BchlrDgr0.10.8-0.5
District of Columbia5. BchlrDgr0.13.4-3.2
Hawaii5. BchlrDgr-0.11.5-1.7
Maryland5. BchlrDgr-0.20.8-1.1
Delaware5. BchlrDgr-0.21.6-2.0
Minnesota5. BchlrDgr-0.40.5-1.3
Kansas5. BchlrDgr-0.60.7-1.8
Massachusetts5. BchlrDgr-0.70.0-1.4
Alabama5. BchlrDgr-0.8-0.1-1.6
Illinois5. BchlrDgr-0.9-0.4-1.3
Nebraska5. BchlrDgr-0.90.3-2.2
Missouri5. BchlrDgr-0.9-0.1-1.7
Wyoming5. BchlrDgr-0.92.6-4.5
Oklahoma5. BchlrDgr-1.2-0.4-1.9
Connecticut5. BchlrDgr-1.2-0.2-2.2
Montana5. BchlrDgr-1.20.8-3.2
South Dakota5. BchlrDgr-1.20.9-3.3
New York5. BchlrDgr-1.3-0.9-1.6
Michigan5. BchlrDgr-1.3-0.8-1.7
Ohio5. BchlrDgr-1.3-0.8-1.8
Indiana5. BchlrDgr-1.3-0.8-1.9
Mississippi5. BchlrDgr-1.4-0.6-2.3
Pennsylvania5. BchlrDgr-1.5-1.1-1.9
Wisconsin5. BchlrDgr-1.7-0.9-2.5
Utah5. BchlrDgr-1.8-0.7-2.8
West Virginia5. BchlrDgr-1.8-1.0-2.7
New Mexico5. BchlrDgr-2.1-1.0-3.1
New Jersey5. BchlrDgr-2.6-2.1-3.1
Iowa5. BchlrDgr-2.6-1.7-3.6
North Dakota5. BchlrDgr-3.4-0.7-6.1
Rhode Island5. BchlrDgr-4.2-2.4-6.0
Vermont5. BchlrDgr-6.0-3.0-8.9
Alaska5. BchlrDgr-8.8-5.3-12.2
Delaware4. AssctDgr2.63.51.6
North Dakota4. AssctDgr2.04.00.0
Montana4. AssctDgr1.53.00.0
Florida4. AssctDgr0.81.00.6
Idaho4. AssctDgr0.81.7-0.1
Colorado4. AssctDgr0.71.20.2
Arizona4. AssctDgr0.71.10.3
South Carolina4. AssctDgr0.71.20.2
Utah4. AssctDgr0.71.30.0
Nevada4. AssctDgr0.71.30.0
Oregon4. AssctDgr0.61.10.1
North Carolina4. AssctDgr0.50.80.2
Maine4. AssctDgr0.51.3-0.4
Hawaii4. AssctDgr0.51.6-0.7
Kentucky4. AssctDgr0.40.8-0.1
Texas4. AssctDgr0.40.50.2
Nebraska4. AssctDgr0.41.2-0.5
Tennessee4. AssctDgr0.30.7-0.1
Missouri4. AssctDgr0.30.7-0.1
Wisconsin4. AssctDgr0.30.6-0.1
Washington4. AssctDgr0.30.7-0.1
Alabama4. AssctDgr0.30.7-0.2
South Dakota4. AssctDgr0.21.8-1.4
Iowa4. AssctDgr0.10.8-0.6
Virginia4. AssctDgr0.10.3-0.2
West Virginia4. AssctDgr0.10.8-0.7
Ohio4. AssctDgr0.00.2-0.2
Maryland4. AssctDgr0.00.4-0.3
Massachusetts4. AssctDgr0.00.3-0.3
Mississippi4. AssctDgr0.00.5-0.5
Oklahoma4. AssctDgr0.00.4-0.4
New Hampshire4. AssctDgr-0.10.8-1.0
Indiana4. AssctDgr-0.10.2-0.4
Georgia4. AssctDgr-0.10.2-0.4
Louisiana4. AssctDgr-0.20.2-0.5
New Jersey4. AssctDgr-0.20.0-0.4
Wyoming4. AssctDgr-0.22.6-2.9
Michigan4. AssctDgr-0.20.0-0.4
California4. AssctDgr-0.3-0.2-0.4
New Mexico4. AssctDgr-0.40.2-1.0
Kansas4. AssctDgr-0.40.2-1.0
Connecticut4. AssctDgr-0.40.0-0.8
Arkansas4. AssctDgr-0.5-0.1-0.8
Minnesota4. AssctDgr-0.50.0-1.0
Pennsylvania4. AssctDgr-0.5-0.2-0.8
Illinois4. AssctDgr-0.7-0.5-1.0
Rhode Island4. AssctDgr-0.80.1-1.8
New York4. AssctDgr-0.9-0.8-1.1
Vermont4. AssctDgr-2.0-0.8-3.2
District of Columbia4. AssctDgr-2.1-0.9-3.3
Alaska4. AssctDgr-3.5-1.4-5.6
North Dakota3. SomeCllg5.28.02.4
Oregon3. SomeCllg3.34.22.5
Nevada3. SomeCllg3.34.52.1
Wyoming3. SomeCllg2.45.8-1.0
Colorado3. SomeCllg2.33.31.4
Arizona3. SomeCllg2.02.81.3
Idaho3. SomeCllg1.93.60.2
South Dakota3. SomeCllg1.73.6-0.2
Delaware3. SomeCllg1.53.4-0.3
Utah3. SomeCllg1.32.60.1
South Carolina3. SomeCllg1.32.20.4
Montana3. SomeCllg1.23.2-0.8
Florida3. SomeCllg1.21.50.8
Arkansas3. SomeCllg1.22.20.1
Texas3. SomeCllg1.01.40.7
Alabama3. SomeCllg0.81.50.1
Georgia3. SomeCllg0.81.40.2
Maine3. SomeCllg0.82.1-0.6
Vermont3. SomeCllg0.72.7-1.2
North Carolina3. SomeCllg0.71.20.1
Tennessee3. SomeCllg0.71.4-0.1
Hawaii3. SomeCllg0.62.6-1.4
Missouri3. SomeCllg0.61.20.0
New Hampshire3. SomeCllg0.61.9-0.7
Kentucky3. SomeCllg0.51.4-0.3
Washington3. SomeCllg0.31.0-0.4
Nebraska3. SomeCllg0.31.6-1.1
Wisconsin3. SomeCllg0.30.9-0.3
Virginia3. SomeCllg0.10.7-0.5
Oklahoma3. SomeCllg0.00.9-0.8
Iowa3. SomeCllg0.00.9-0.9
Ohio3. SomeCllg0.00.4-0.4
Indiana3. SomeCllg0.00.6-0.7
Kansas3. SomeCllg-0.10.9-1.2
Rhode Island3. SomeCllg-0.21.1-1.4
West Virginia3. SomeCllg-0.20.9-1.3
Louisiana3. SomeCllg-0.30.6-1.1
Massachusetts3. SomeCllg-0.40.1-0.9
Mississippi3. SomeCllg-0.40.6-1.5
Maryland3. SomeCllg-0.50.1-1.1
Pennsylvania3. SomeCllg-0.5-0.1-0.8
Michigan3. SomeCllg-0.6-0.2-1.0
Minnesota3. SomeCllg-0.60.0-1.2
Connecticut3. SomeCllg-0.7-0.1-1.4
New Mexico3. SomeCllg-0.80.5-2.1
District of Columbia3. SomeCllg-1.31.0-3.5
California3. SomeCllg-1.3-1.1-1.5
New Jersey3. SomeCllg-1.4-1.1-1.8
Illinois3. SomeCllg-1.5-1.1-1.8
New York3. SomeCllg-1.9-1.7-2.1
Alaska3. SomeCllg-14.1-10.0-18.1
Nevada2. HsDgrEqv3.24.42.0
Idaho2. HsDgrEqv2.84.31.3
Delaware2. HsDgrEqv2.24.00.3
Florida2. HsDgrEqv2.12.51.7
Oregon2. HsDgrEqv1.72.31.0
New Hampshire2. HsDgrEqv1.52.80.1
South Carolina2. HsDgrEqv1.42.30.6
Arizona2. HsDgrEqv1.42.10.8
Arkansas2. HsDgrEqv1.42.50.3
Colorado2. HsDgrEqv1.11.70.4
Washington2. HsDgrEqv1.01.60.4
Georgia2. HsDgrEqv0.91.30.5
New Mexico2. HsDgrEqv0.92.0-0.2
Utah2. HsDgrEqv0.71.6-0.1
Texas2. HsDgrEqv0.71.00.4
North Dakota2. HsDgrEqv0.74.0-2.7
Tennessee2. HsDgrEqv0.61.30.0
Indiana2. HsDgrEqv0.51.00.0
North Carolina2. HsDgrEqv0.51.0-0.1
Nebraska2. HsDgrEqv0.41.5-0.7
Louisiana2. HsDgrEqv0.31.0-0.4
Kentucky2. HsDgrEqv0.31.1-0.5
Iowa2. HsDgrEqv0.31.3-0.7
Missouri2. HsDgrEqv0.30.9-0.3
Oklahoma2. HsDgrEqv0.31.3-0.8
Wisconsin2. HsDgrEqv0.20.7-0.2
Virginia2. HsDgrEqv0.20.7-0.3
Ohio2. HsDgrEqv0.20.5-0.2
Montana2. HsDgrEqv0.12.1-1.9
West Virginia2. HsDgrEqv-0.11.6-1.7
Maryland2. HsDgrEqv-0.10.5-0.6
Michigan2. HsDgrEqv-0.10.2-0.5
Alabama2. HsDgrEqv-0.30.4-1.0
Pennsylvania2. HsDgrEqv-0.30.1-0.7
Kansas2. HsDgrEqv-0.30.8-1.4
Minnesota2. HsDgrEqv-0.40.1-0.9
Maine2. HsDgrEqv-0.40.9-1.7
Mississippi2. HsDgrEqv-0.50.5-1.6
Rhode Island2. HsDgrEqv-0.70.6-2.0
Wyoming2. HsDgrEqv-0.82.5-4.0
New Jersey2. HsDgrEqv-1.0-0.6-1.4
California2. HsDgrEqv-1.0-0.8-1.2
South Dakota2. HsDgrEqv-1.10.7-3.0
Massachusetts2. HsDgrEqv-1.2-0.7-1.6
Connecticut2. HsDgrEqv-1.2-0.6-1.8
Illinois2. HsDgrEqv-1.3-0.9-1.6
Vermont2. HsDgrEqv-1.40.0-2.9
New York2. HsDgrEqv-1.9-1.6-2.1
Hawaii2. HsDgrEqv-2.0-0.2-3.7
District of Columbia2. HsDgrEqv-7.4-5.5-9.4
Alaska2. HsDgrEqv-20.4-17.0-23.9
Delaware1. LssHsDgr1.22.30.2
Oklahoma1. LssHsDgr1.01.60.4
Wyoming1. LssHsDgr0.93.1-1.2
Nevada1. LssHsDgr0.91.70.1
Kansas1. LssHsDgr0.71.30.0
South Dakota1. LssHsDgr0.61.9-0.7
Minnesota1. LssHsDgr0.50.90.2
Georgia1. LssHsDgr0.50.80.2
Louisiana1. LssHsDgr0.50.90.1
North Dakota1. LssHsDgr0.51.5-0.5
Wisconsin1. LssHsDgr0.50.80.2
Mississippi1. LssHsDgr0.51.1-0.2
Texas1. LssHsDgr0.40.60.3
Tennessee1. LssHsDgr0.40.80.0
Oregon1. LssHsDgr0.40.9-0.1
Colorado1. LssHsDgr0.40.80.0
Washington1. LssHsDgr0.40.80.1
Michigan1. LssHsDgr0.30.60.1
New Mexico1. LssHsDgr0.31.1-0.4
West Virginia1. LssHsDgr0.31.1-0.5
Ohio1. LssHsDgr0.30.50.0
Kentucky1. LssHsDgr0.30.7-0.2
Indiana1. LssHsDgr0.30.6-0.1
Pennsylvania1. LssHsDgr0.30.50.0
Rhode Island1. LssHsDgr0.21.2-0.7
Arkansas1. LssHsDgr0.20.9-0.5
Missouri1. LssHsDgr0.20.6-0.2
Utah1. LssHsDgr0.10.7-0.5
Iowa1. LssHsDgr0.10.7-0.5
Maryland1. LssHsDgr0.00.4-0.3
Florida1. LssHsDgr0.00.2-0.2
North Carolina1. LssHsDgr0.00.3-0.3
Virginia1. LssHsDgr0.00.3-0.3
Connecticut1. LssHsDgr0.00.4-0.4
South Carolina1. LssHsDgr-0.10.3-0.5
Montana1. LssHsDgr-0.11.0-1.2
Arizona1. LssHsDgr-0.10.3-0.6
New Jersey1. LssHsDgr-0.20.1-0.4
Nebraska1. LssHsDgr-0.20.6-1.0
New Hampshire1. LssHsDgr-0.20.6-1.1
California1. LssHsDgr-0.4-0.3-0.5
Massachusetts1. LssHsDgr-0.4-0.1-0.8
Alabama1. LssHsDgr-0.50.0-1.0
Hawaii1. LssHsDgr-0.6-0.1-1.2
Vermont1. LssHsDgr-0.60.6-1.9
Illinois1. LssHsDgr-0.7-0.5-0.9
Maine1. LssHsDgr-0.70.0-1.4
Idaho1. LssHsDgr-0.80.2-1.8
New York1. LssHsDgr-0.9-0.7-1.0
District of Columbia1. LssHsDgr-2.5-1.2-3.8
Alaska1. LssHsDgr-8.0-6.0-10.0

Net (in) Migration per 1000 Ed-Attainment Rsd.( 22-64 years old)
StateEd. Attainmentper 1000 Ed.RsdUpperLower
Washington6. Grdts21.125.117.0
Montana6. Grdts17.335.1-0.5
South Carolina6. Grdts13.218.77.7
Nevada6. Grdts13.022.53.5
Delaware6. Grdts12.525.00.0
Colorado6. Grdts11.517.05.9
Oregon6. Grdts11.117.84.3
Texas6. Grdts10.912.99.0
Utah6. Grdts9.818.70.9
Idaho6. Grdts9.422.8-3.9
New Hampshire6. Grdts9.119.9-1.7
Arizona6. Grdts8.514.03.0
North Carolina6. Grdts7.712.03.3
Maine6. Grdts6.918.9-5.0
Florida6. Grdts6.39.23.5
Vermont6. Grdts5.925.6-13.7
California6. Grdts5.67.23.9
New Mexico6. Grdts4.513.5-4.6
South Dakota6. Grdts3.420.4-13.5
Minnesota6. Grdts3.38.3-1.6
Maryland6. Grdts2.46.0-1.3
Wyoming6. Grdts1.822.0-18.4
Alabama6. Grdts1.67.1-3.9
Tennessee6. Grdts0.95.8-4.0
Iowa6. Grdts0.78.3-7.0
Virginia6. Grdts0.34.0-3.5
Arkansas6. Grdts-1.26.8-9.2
Georgia6. Grdts-2.11.8-6.0
Connecticut6. Grdts-3.00.9-6.9
Louisiana6. Grdts-3.12.7-9.0
Massachusetts6. Grdts-3.4-0.1-6.6
North Dakota6. Grdts-3.621.8-29.1
Hawaii6. Grdts-4.48.2-17.0
Wisconsin6. Grdts-4.51.1-10.1
Ohio6. Grdts-4.8-1.0-8.6
Kansas6. Grdts-5.72.3-13.6
Nebraska6. Grdts-6.42.7-15.5
Michigan6. Grdts-7.0-3.7-10.3
Mississippi6. Grdts-7.3-0.4-14.1
New Jersey6. Grdts-7.5-4.7-10.3
Indiana6. Grdts-7.9-3.2-12.5
Pennsylvania6. Grdts-7.9-5.3-10.5
Missouri6. Grdts-9.2-4.7-13.8
West Virginia6. Grdts-10.0-1.9-18.0
Kentucky6. Grdts-10.1-5.7-14.5
Illinois6. Grdts-11.1-8.3-13.9
New York6. Grdts-11.3-9.3-13.3
Rhode Island6. Grdts-11.60.7-24.0
Oklahoma6. Grdts-14.2-7.3-21.1
District of Columbia6. Grdts-16.4-3.7-29.1
Alaska6. Grdts-43.1-19.4-66.8
Colorado5. BchlrDgr16.220.012.4
Nevada5. BchlrDgr15.521.89.2
Washington5. BchlrDgr12.716.39.0
Oregon5. BchlrDgr11.717.06.4
Arizona5. BchlrDgr11.115.56.8
Texas5. BchlrDgr8.19.56.7
Florida5. BchlrDgr6.68.44.9
North Carolina5. BchlrDgr6.69.53.6
Maine5. BchlrDgr6.014.4-2.4
South Carolina5. BchlrDgr6.011.01.0
Tennessee5. BchlrDgr5.99.91.8
Louisiana5. BchlrDgr3.98.6-0.8
Idaho5. BchlrDgr3.912.9-5.2
New Hampshire5. BchlrDgr3.611.2-4.0
Arkansas5. BchlrDgr3.28.9-2.5
California5. BchlrDgr3.04.12.0
Virginia5. BchlrDgr1.64.5-1.4
Kentucky5. BchlrDgr0.85.3-3.7
Georgia5. BchlrDgr0.73.6-2.1
District of Columbia5. BchlrDgr0.412.2-11.5
Hawaii5. BchlrDgr-0.37.0-7.7
Maryland5. BchlrDgr-0.83.4-5.1
Delaware5. BchlrDgr-1.08.2-10.1
Minnesota5. BchlrDgr-1.61.9-5.1
Kansas5. BchlrDgr-2.73.1-8.4
Massachusetts5. BchlrDgr-2.8-0.2-5.4
Illinois5. BchlrDgr-3.9-1.7-6.0
Nebraska5. BchlrDgr-4.11.5-9.6
Missouri5. BchlrDgr-4.9-0.7-9.1
Connecticut5. BchlrDgr-5.0-0.7-9.3
Alabama5. BchlrDgr-5.3-0.4-10.2
Wyoming5. BchlrDgr-5.315.0-25.6
New York5. BchlrDgr-5.7-4.1-7.3
South Dakota5. BchlrDgr-5.74.4-15.9
Montana5. BchlrDgr-5.84.1-15.8
Oklahoma5. BchlrDgr-6.7-2.2-11.1
Michigan5. BchlrDgr-7.0-4.5-9.4
Ohio5. BchlrDgr-7.3-4.6-10.0
Pennsylvania5. BchlrDgr-7.4-5.3-9.5
Indiana5. BchlrDgr-7.6-4.5-10.6
Wisconsin5. BchlrDgr-8.1-4.5-11.8
Utah5. BchlrDgr-8.5-3.3-13.8
New Jersey5. BchlrDgr-10.2-8.1-12.3
Mississippi5. BchlrDgr-10.5-4.2-16.9
Iowa5. BchlrDgr-12.8-8.1-17.5
New Mexico5. BchlrDgr-14.0-7.0-20.9
West Virginia5. BchlrDgr-14.1-7.2-20.9
North Dakota5. BchlrDgr-14.9-3.2-26.6
Rhode Island5. BchlrDgr-19.6-11.2-27.9
Vermont5. BchlrDgr-25.6-13.0-38.3
Alaska5. BchlrDgr-48.5-29.3-67.6
Delaware4. AssctDgr32.143.920.2
Montana4. AssctDgr15.530.90.1
North Dakota4. AssctDgr13.226.40.0
Nevada4. AssctDgr8.216.10.2
Colorado4. AssctDgr8.013.92.2
Idaho4. AssctDgr7.916.7-0.9
Arizona4. AssctDgr7.811.93.7
Florida4. AssctDgr7.39.05.6
South Carolina4. AssctDgr7.312.22.4
Utah4. AssctDgr6.312.50.2
Oregon4. AssctDgr6.111.60.6
North Carolina4. AssctDgr5.28.41.9
Texas4. AssctDgr5.06.93.1
Kentucky4. AssctDgr4.49.5-0.7
Maine4. AssctDgr4.312.0-3.3
Tennessee4. AssctDgr4.19.7-1.5
Hawaii4. AssctDgr4.014.0-5.9
Missouri4. AssctDgr3.37.8-1.1
Nebraska4. AssctDgr3.211.0-4.7
Alabama4. AssctDgr2.97.9-2.1
Washington4. AssctDgr2.66.4-1.3
Wisconsin4. AssctDgr2.45.6-0.9
South Dakota4. AssctDgr1.613.9-10.7
Virginia4. AssctDgr0.94.4-2.7
West Virginia4. AssctDgr0.810.5-8.8
Iowa4. AssctDgr0.85.7-4.2
Ohio4. AssctDgr0.42.5-1.6
Maryland4. AssctDgr0.35.5-5.0
Massachusetts4. AssctDgr0.03.3-3.4
Mississippi4. AssctDgr-0.24.9-5.2
Oklahoma4. AssctDgr-0.44.7-5.5
New Hampshire4. AssctDgr-0.98.1-9.9
Indiana4. AssctDgr-1.32.0-4.5
Wyoming4. AssctDgr-1.621.5-24.7
Georgia4. AssctDgr-1.82.1-5.7
Michigan4. AssctDgr-2.00.1-4.1
New Jersey4. AssctDgr-2.70.7-6.0
Louisiana4. AssctDgr-2.73.2-8.6
Minnesota4. AssctDgr-3.70.3-7.7
California4. AssctDgr-4.2-3.0-5.5
New Mexico4. AssctDgr-4.32.2-10.9
Kansas4. AssctDgr-4.61.7-10.9
Connecticut4. AssctDgr-5.4-0.6-10.2
Pennsylvania4. AssctDgr-5.5-2.7-8.4
Arkansas4. AssctDgr-6.3-1.0-11.6
Illinois4. AssctDgr-8.5-5.7-11.3
Rhode Island4. AssctDgr-9.11.3-19.6
New York4. AssctDgr-9.8-8.3-11.3
Vermont4. AssctDgr-23.5-9.0-38.0
Alaska4. AssctDgr-43.1-17.6-68.6
District of Columbia4. AssctDgr-68.2-29.2-107.2
North Dakota3. SomeCllg20.832.09.6
Oregon3. SomeCllg12.415.59.3
Nevada3. SomeCllg12.116.67.7
Colorado3. SomeCllg10.114.16.1
Wyoming3. SomeCllg8.720.9-3.5
Arizona3. SomeCllg7.710.64.8
Delaware3. SomeCllg7.416.3-1.5
South Dakota3. SomeCllg7.215.5-1.0
Idaho3. SomeCllg6.812.80.8
South Carolina3. SomeCllg5.69.71.5
Florida3. SomeCllg5.46.93.9
Arkansas3. SomeCllg4.89.00.6
Utah3. SomeCllg4.68.90.3
Montana3. SomeCllg4.612.2-3.1
Texas3. SomeCllg4.45.73.1
Vermont3. SomeCllg3.713.6-6.2
Maine3. SomeCllg3.59.5-2.6
Georgia3. SomeCllg3.46.00.9
Alabama3. SomeCllg3.46.20.6
Tennessee3. SomeCllg3.06.2-0.3
New Hampshire3. SomeCllg2.99.3-3.5
North Carolina3. SomeCllg2.95.30.4
Hawaii3. SomeCllg2.510.9-5.8
Missouri3. SomeCllg2.44.90.0
Kentucky3. SomeCllg2.46.0-1.3
Washington3. SomeCllg1.23.9-1.4
Wisconsin3. SomeCllg1.23.7-1.4
Nebraska3. SomeCllg1.26.8-4.4
Virginia3. SomeCllg0.53.2-2.1
Oklahoma3. SomeCllg0.23.5-3.1
Iowa3. SomeCllg0.13.9-3.7
Ohio3. SomeCllg0.01.8-1.8
Indiana3. SomeCllg-0.12.8-3.0
Kansas3. SomeCllg-0.53.6-4.6
Rhode Island3. SomeCllg-0.85.0-6.7
West Virginia3. SomeCllg-0.94.3-6.2
Louisiana3. SomeCllg-1.12.6-4.9
Mississippi3. SomeCllg-1.72.6-6.1
Michigan3. SomeCllg-2.2-0.7-3.7
Maryland3. SomeCllg-2.30.5-5.1
Massachusetts3. SomeCllg-2.30.3-4.9
Minnesota3. SomeCllg-2.70.1-5.4
Pennsylvania3. SomeCllg-2.7-0.8-4.6
New Mexico3. SomeCllg-3.12.1-8.3
Connecticut3. SomeCllg-3.9-0.3-7.5
California3. SomeCllg-5.6-5.0-6.3
Illinois3. SomeCllg-6.6-4.9-8.2
New Jersey3. SomeCllg-7.9-5.8-9.9
District of Columbia3. SomeCllg-9.47.1-26.0
New York3. SomeCllg-10.8-9.5-12.1
Alaska3. SomeCllg-47.4-33.8-61.1
Nevada2. HsDgrEqv11.215.47.1
Idaho2. HsDgrEqv10.115.64.6
Florida2. HsDgrEqv7.58.96.1
Delaware2. HsDgrEqv7.313.61.0
Oregon2. HsDgrEqv7.210.24.2
Arizona2. HsDgrEqv5.98.63.2
New Hampshire2. HsDgrEqv5.510.40.5
Colorado2. HsDgrEqv5.18.22.0
South Carolina2. HsDgrEqv5.07.92.0
Washington2. HsDgrEqv4.57.11.9
Arkansas2. HsDgrEqv4.17.40.8
New Mexico2. HsDgrEqv3.47.5-0.8
Georgia2. HsDgrEqv3.34.91.8
Utah2. HsDgrEqv3.37.2-0.6
Texas2. HsDgrEqv2.83.91.7
North Dakota2. HsDgrEqv2.816.6-11.0
Tennessee2. HsDgrEqv2.03.90.1
North Carolina2. HsDgrEqv1.94.1-0.2
Nebraska2. HsDgrEqv1.96.5-2.8
Indiana2. HsDgrEqv1.63.20.0
Iowa2. HsDgrEqv1.14.6-2.4
Kentucky2. HsDgrEqv1.03.4-1.4
Louisiana2. HsDgrEqv1.03.0-1.1
Missouri2. HsDgrEqv0.93.1-1.2
Virginia2. HsDgrEqv0.93.0-1.3
Wisconsin2. HsDgrEqv0.82.5-0.8
Oklahoma2. HsDgrEqv0.84.2-2.6
Ohio2. HsDgrEqv0.51.7-0.7
Montana2. HsDgrEqv0.37.1-6.6
West Virginia2. HsDgrEqv-0.14.0-4.3
Maryland2. HsDgrEqv-0.32.0-2.6
Michigan2. HsDgrEqv-0.50.9-1.9
Pennsylvania2. HsDgrEqv-0.90.3-2.0
Alabama2. HsDgrEqv-0.91.4-3.3
Kansas2. HsDgrEqv-1.33.2-5.7
Maine2. HsDgrEqv-1.32.7-5.4
Mississippi2. HsDgrEqv-1.71.8-5.2
Minnesota2. HsDgrEqv-1.70.5-3.9
Rhode Island2. HsDgrEqv-2.82.4-7.9
Wyoming2. HsDgrEqv-2.88.7-14.3
New Jersey2. HsDgrEqv-3.7-2.1-5.3
South Dakota2. HsDgrEqv-4.02.4-10.3
Connecticut2. HsDgrEqv-4.7-2.3-7.2
Vermont2. HsDgrEqv-4.90.0-9.9
California2. HsDgrEqv-5.0-4.0-5.9
Massachusetts2. HsDgrEqv-5.2-3.2-7.1
Illinois2. HsDgrEqv-5.2-3.7-6.7
Hawaii2. HsDgrEqv-7.2-0.8-13.6
New York2. HsDgrEqv-7.7-6.7-8.7
District of Columbia2. HsDgrEqv-44.9-33.0-56.8
Alaska2. HsDgrEqv-73.4-61.0-85.8
Wyoming1. LssHsDgr14.647.5-18.3
Delaware1. LssHsDgr12.422.42.3
North Dakota1. LssHsDgr9.728.8-9.4
South Dakota1. LssHsDgr9.027.4-9.3
Minnesota1. LssHsDgr8.814.43.1
Oklahoma1. LssHsDgr8.413.33.4
Kansas1. LssHsDgr7.214.6-0.2
Wisconsin1. LssHsDgr6.410.42.4
Nevada1. LssHsDgr6.311.80.9
Colorado1. LssHsDgr4.79.6-0.2
Washington1. LssHsDgr4.58.40.6
Georgia1. LssHsDgr4.36.71.9
Oregon1. LssHsDgr4.29.2-0.7
Michigan1. LssHsDgr4.06.61.4
Tennessee1. LssHsDgr3.87.30.3
Louisiana1. LssHsDgr3.66.50.7
Ohio1. LssHsDgr3.36.00.5
Mississippi1. LssHsDgr3.27.9-1.5
Pennsylvania1. LssHsDgr3.26.20.2
Texas1. LssHsDgr2.73.61.8
West Virginia1. LssHsDgr2.69.5-4.2
Indiana1. LssHsDgr2.65.7-0.6
Rhode Island1. LssHsDgr2.411.2-6.5
New Mexico1. LssHsDgr2.47.5-2.8
Kentucky1. LssHsDgr2.25.9-1.4
Missouri1. LssHsDgr1.96.1-2.3
Arkansas1. LssHsDgr1.77.1-3.8
Iowa1. LssHsDgr1.710.5-7.2
Utah1. LssHsDgr1.48.6-5.7
Maryland1. LssHsDgr0.54.3-3.2
Florida1. LssHsDgr0.01.9-2.0
North Carolina1. LssHsDgr-0.22.4-2.7
Virginia1. LssHsDgr-0.22.9-3.4
Connecticut1. LssHsDgr-0.54.5-5.4
South Carolina1. LssHsDgr-0.82.4-4.1
Arizona1. LssHsDgr-1.12.1-4.2
New Jersey1. LssHsDgr-1.81.0-4.6
Montana1. LssHsDgr-2.015.1-19.0
Nebraska1. LssHsDgr-2.37.4-12.0
California1. LssHsDgr-2.5-1.9-3.1
Alabama1. LssHsDgr-3.9-0.2-7.6
New Hampshire1. LssHsDgr-4.010.3-18.2
Massachusetts1. LssHsDgr-5.5-1.6-9.5
Illinois1. LssHsDgr-7.0-4.8-9.2
New York1. LssHsDgr-7.3-6.0-8.6
Idaho1. LssHsDgr-8.71.7-19.1
Vermont1. LssHsDgr-9.89.3-28.9
Hawaii1. LssHsDgr-9.9-0.9-18.8
Maine1. LssHsDgr-12.4-0.8-24.0
District of Columbia1. LssHsDgr-29.5-14.4-44.7
Alaska1. LssHsDgr-117.8-88.8-146.8

Main body here

Monday, January 01, 2018

Brain Drain - 2011-07 ACS State Migration for Working Age population


A data release concerning educational population migrated between states in the United States of America. The report is based on US census' ACS 5-year PUMS data for 2011-2007!
This is a data update of my previous article 'Brain Drain - 2015 ACS State Migration for Working Age'. The data presented here is based on US census' ACS 5-year PUMS data release that covers 2011 to 2007.

As mentioned in my other recent articles, even though these are data updates, but due to survey changes and re-structure of program codes, it takes a while to get data ready for release.

Since this is a data update of my forementioned article, please refer to that article for detailed description of data. Over here, I will simply summarize the type of data that are made available.

With this data release, reader can explorer the number of people that moved to your state per year from each other state. Reader can also explorer the education attainment level of these migrated population. On the reverse side, reader can also explore the number of people leave your state and move to each other state, again, with the education attainment status available. Finally, the net migration is made available with 90% margin of error presented, which provide a sense of confidence for the data.

The released data is published via Tableau Public at here.

Related articles:
Nebraska Brain Drain Migration and Ed. Attainment, 2015 United States ACS
 

Sunday, December 31, 2017

Brain Drain - Ranking and Analysis with 2011 ACS 5-year PUMS

Original Article

An analysis of the 2011 5-year ACS education attainment and migration data with the ranking for each US state.

Early this year when I preparing for the article 'Brain Drain - Ranking and Analysis with 2015 ACS data', I was working against time and a lot of arrangement and calculations were handled directly through database and spreadsheets manually without much programming code to ease and reduce the amount of work needed - from automation/development point of view, this is not uncommon that you first explore your process and goals by hand to gain better understanding of what is involved, then establish the automation process given that automation is a costly and inflexible process - once established, making adjustment can, sometimes, mean the rebuild of the whole system.

After I finishing the previously mentioned article, i spent some time writing R interface code in an attempt to reduce the amount of works. However, as found recently, those code does the task well but isn't quite flexible. Any change to the data or requirement could mean major changes. So when I begin to work on the 2011-07 ACS 5-year PUMS dataset, I re-wrote the code few times to, at least, accommodate known and expected data changes and goal variations. This also caused changes to all tasks that now deriving result from the R interface.

So, even though this article presented information in a similar format as the prior mentioned article, it is based on a totally new process. The data is again, presented through Tableau Public at here. Since, from the surface and readers' view, this is simply a data update, please referring to the forementioned article for the general descriptions.

Over here, we will simply present two ranking tables for your convenience. Again, you can refer to forementioned article for explanation.


StateEd. Attainmentper 1000 RsdUpperLower
Delaware6. Grdts2.13.70.6
Oregon6. Grdts1.82.41.2
Maine6. Grdts1.82.80.7
Washington6. Grdts1.41.91.0
Vermont6. Grdts1.33.6-0.9
Montana6. Grdts1.12.10.1
Colorado6. Grdts0.91.50.4
Virginia6. Grdts0.91.40.3
Nevada6. Grdts0.81.40.2
Maryland6. Grdts0.71.30.1
Texas6. Grdts0.60.80.4
South Carolina6. Grdts0.51.00.0
North Carolina6. Grdts0.50.80.1
District of Columbia6. Grdts0.54.1-3.2
New Hampshire6. Grdts0.51.6-0.7
Kentucky6. Grdts0.30.8-0.1
Alabama6. Grdts0.30.7-0.1
New Mexico6. Grdts0.31.2-0.7
Florida6. Grdts0.20.50.0
Arkansas6. Grdts0.20.9-0.5
Minnesota6. Grdts0.20.7-0.3
Wyoming6. Grdts0.21.6-1.3
Georgia6. Grdts0.10.5-0.2
Utah6. Grdts0.10.8-0.5
Wisconsin6. Grdts0.10.5-0.3
California6. Grdts0.10.3-0.1
Arizona6. Grdts0.10.5-0.4
Tennessee6. Grdts0.10.5-0.3
Kansas6. Grdts0.10.9-0.8
Oklahoma6. Grdts0.00.6-0.5
New Jersey6. Grdts0.00.3-0.4
Connecticut6. Grdts0.00.5-0.6
Idaho6. Grdts0.00.9-1.0
South Dakota6. Grdts-0.11.3-1.6
Mississippi6. Grdts-0.40.1-0.8
Iowa6. Grdts-0.40.2-1.0
Missouri6. Grdts-0.40.1-0.9
Ohio6. Grdts-0.4-0.1-0.7
Pennsylvania6. Grdts-0.4-0.1-0.7
Louisiana6. Grdts-0.5-0.1-1.0
Indiana6. Grdts-0.5-0.2-0.9
Illinois6. Grdts-0.6-0.3-1.0
Massachusetts6. Grdts-0.7-0.2-1.2
Hawaii6. Grdts-0.80.2-1.9
New York6. Grdts-1.0-0.7-1.2
West Virginia6. Grdts-1.0-0.4-1.7
Michigan6. Grdts-1.5-1.2-1.9
North Dakota6. Grdts-1.7-0.1-3.3
Nebraska6. Grdts-1.7-0.8-2.7
Rhode Island6. Grdts-2.1-0.7-3.5
Alaska6. Grdts-3.6-1.8-5.4
Colorado5. BchlrDgr2.63.61.7
Oregon5. BchlrDgr2.53.31.6
District of Columbia5. BchlrDgr2.06.5-2.6
Texas5. BchlrDgr1.82.11.6
Arizona5. BchlrDgr1.72.50.9
South Carolina5. BchlrDgr1.62.30.9
New Mexico5. BchlrDgr1.62.70.5
North Carolina5. BchlrDgr1.42.00.9
Virginia5. BchlrDgr1.42.20.5
Washington5. BchlrDgr1.01.60.3
Delaware5. BchlrDgr0.92.8-0.9
Arkansas5. BchlrDgr0.71.7-0.2
Georgia5. BchlrDgr0.71.20.1
Florida5. BchlrDgr0.40.80.1
Maryland5. BchlrDgr0.41.0-0.3
Minnesota5. BchlrDgr0.41.2-0.5
Nevada5. BchlrDgr0.31.6-0.9
Tennessee5. BchlrDgr0.20.9-0.4
California5. BchlrDgr0.20.40.0
Oklahoma5. BchlrDgr0.21.0-0.7
Louisiana5. BchlrDgr0.10.8-0.5
Nebraska5. BchlrDgr0.11.3-1.2
Illinois5. BchlrDgr0.00.4-0.5
Kentucky5. BchlrDgr-0.20.5-0.9
Hawaii5. BchlrDgr-0.21.6-2.0
Connecticut5. BchlrDgr-0.30.5-1.0
Missouri5. BchlrDgr-0.30.4-1.0
Maine5. BchlrDgr-0.50.8-1.8
Rhode Island5. BchlrDgr-0.61.3-2.4
Pennsylvania5. BchlrDgr-0.6-0.1-1.1
Alabama5. BchlrDgr-0.60.0-1.3
New York5. BchlrDgr-0.6-0.3-1.0
Massachusetts5. BchlrDgr-0.8-0.1-1.6
Idaho5. BchlrDgr-0.91.0-2.8
Mississippi5. BchlrDgr-1.0-0.1-1.9
New Hampshire5. BchlrDgr-1.00.6-2.6
New Jersey5. BchlrDgr-1.1-0.5-1.7
West Virginia5. BchlrDgr-1.1-0.1-2.1
Iowa5. BchlrDgr-1.2-0.3-2.2
Kansas5. BchlrDgr-1.20.0-2.4
Indiana5. BchlrDgr-1.5-0.9-2.0
Ohio5. BchlrDgr-1.9-1.5-2.2
South Dakota5. BchlrDgr-2.00.3-4.3
Utah5. BchlrDgr-2.1-1.1-3.0
Wisconsin5. BchlrDgr-2.2-1.5-2.9
Montana5. BchlrDgr-2.5-0.6-4.5
Wyoming5. BchlrDgr-2.6-0.5-4.7
North Dakota5. BchlrDgr-2.90.3-6.0
Michigan5. BchlrDgr-3.0-2.6-3.4
Vermont5. BchlrDgr-3.4-0.1-6.8
Alaska5. BchlrDgr-11.3-8.1-14.5
North Dakota4. AssctDgr1.03.0-1.0
Montana4. AssctDgr1.02.2-0.3
Oregon4. AssctDgr0.91.40.4
Arizona4. AssctDgr0.91.30.5
South Carolina4. AssctDgr0.81.20.4
North Carolina4. AssctDgr0.71.00.5
Oklahoma4. AssctDgr0.61.10.2
Utah4. AssctDgr0.61.10.1
Texas4. AssctDgr0.50.60.4
Missouri4. AssctDgr0.40.80.0
Virginia4. AssctDgr0.30.70.0
Kentucky4. AssctDgr0.30.7-0.1
Iowa4. AssctDgr0.30.8-0.2
Georgia4. AssctDgr0.20.50.0
Maine4. AssctDgr0.21.0-0.5
New Hampshire4. AssctDgr0.21.1-0.6
Tennessee4. AssctDgr0.20.6-0.1
Indiana4. AssctDgr0.20.5-0.1
Washington4. AssctDgr0.20.6-0.2
Colorado4. AssctDgr0.20.7-0.3
Alabama4. AssctDgr0.20.5-0.2
Delaware4. AssctDgr0.20.9-0.6
Nebraska4. AssctDgr0.21.0-0.7
West Virginia4. AssctDgr0.10.7-0.5
Nevada4. AssctDgr0.10.9-0.7
Pennsylvania4. AssctDgr0.10.3-0.1
Massachusetts4. AssctDgr0.10.3-0.2
Florida4. AssctDgr0.10.3-0.2
New Mexico4. AssctDgr0.00.7-0.6
Connecticut4. AssctDgr-0.10.4-0.5
Ohio4. AssctDgr-0.10.1-0.3
Arkansas4. AssctDgr-0.10.4-0.6
New Jersey4. AssctDgr-0.10.1-0.4
Mississippi4. AssctDgr-0.10.4-0.7
Wisconsin4. AssctDgr-0.10.2-0.5
Louisiana4. AssctDgr-0.20.2-0.5
Maryland4. AssctDgr-0.20.2-0.6
Hawaii4. AssctDgr-0.31.1-1.6
District of Columbia4. AssctDgr-0.31.0-1.6
Kansas4. AssctDgr-0.40.2-1.0
California4. AssctDgr-0.4-0.3-0.5
South Dakota4. AssctDgr-0.40.9-1.7
Illinois4. AssctDgr-0.5-0.3-0.7
Minnesota4. AssctDgr-0.6-0.2-1.0
New York4. AssctDgr-0.6-0.5-0.8
Michigan4. AssctDgr-0.7-0.4-0.9
Idaho4. AssctDgr-1.00.0-2.0
Wyoming4. AssctDgr-1.00.5-2.4
Rhode Island4. AssctDgr-1.0-0.1-2.0
Vermont4. AssctDgr-2.1-0.8-3.4
Alaska4. AssctDgr-4.3-2.4-6.1
Idaho3. SomeCllg3.45.01.8
Colorado3. SomeCllg2.73.51.9
South Carolina3. SomeCllg2.53.31.6
Nevada3. SomeCllg2.33.61.0
Arizona3. SomeCllg2.22.91.5
Oregon3. SomeCllg2.13.11.2
Montana3. SomeCllg2.14.10.0
North Carolina3. SomeCllg1.82.31.3
Oklahoma3. SomeCllg1.72.60.8
Arkansas3. SomeCllg1.52.30.7
Nebraska3. SomeCllg1.53.00.0
Delaware3. SomeCllg1.43.1-0.3
Tennessee3. SomeCllg1.32.00.6
Alabama3. SomeCllg1.21.90.5
Washington3. SomeCllg1.11.90.3
Texas3. SomeCllg1.01.30.7
New Mexico3. SomeCllg1.02.4-0.4
Missouri3. SomeCllg0.71.40.1
Louisiana3. SomeCllg0.71.40.0
Utah3. SomeCllg0.61.8-0.5
Pennsylvania3. SomeCllg0.60.90.2
Kansas3. SomeCllg0.51.6-0.6
Virginia3. SomeCllg0.51.00.0
South Dakota3. SomeCllg0.42.2-1.4
Kentucky3. SomeCllg0.31.2-0.6
Wisconsin3. SomeCllg0.20.8-0.4
Georgia3. SomeCllg0.20.7-0.3
Vermont3. SomeCllg0.12.1-1.8
Massachusetts3. SomeCllg0.10.5-0.4
Iowa3. SomeCllg0.01.0-0.9
North Dakota3. SomeCllg-0.12.5-2.7
Florida3. SomeCllg-0.20.2-0.6
Indiana3. SomeCllg-0.20.3-0.8
Ohio3. SomeCllg-0.5-0.2-0.8
West Virginia3. SomeCllg-0.60.7-1.9
Maryland3. SomeCllg-0.60.0-1.2
Minnesota3. SomeCllg-0.7-0.1-1.4
Mississippi3. SomeCllg-0.80.1-1.7
Illinois3. SomeCllg-0.9-0.5-1.3
Maine3. SomeCllg-1.00.2-2.3
New Hampshire3. SomeCllg-1.10.3-2.5
California3. SomeCllg-1.2-1.0-1.4
New Jersey3. SomeCllg-1.3-0.8-1.7
New York3. SomeCllg-1.5-1.2-1.7
Michigan3. SomeCllg-1.8-1.4-2.1
Connecticut3. SomeCllg-1.9-1.3-2.4
Wyoming3. SomeCllg-2.21.9-6.2
Rhode Island3. SomeCllg-2.2-1.0-3.4
Hawaii3. SomeCllg-2.5-0.4-4.6
District of Columbia3. SomeCllg-2.8-0.6-5.1
Alaska3. SomeCllg-15.9-11.6-20.2
South Dakota2. HsDgrEqv3.96.11.8
Oklahoma2. HsDgrEqv2.43.41.4
Kentucky2. HsDgrEqv2.33.11.5
North Dakota2. HsDgrEqv2.04.1-0.1
Montana2. HsDgrEqv1.73.40.1
Tennessee2. HsDgrEqv1.72.41.0
Arkansas2. HsDgrEqv1.62.70.5
North Carolina2. HsDgrEqv1.41.90.8
Wyoming2. HsDgrEqv1.44.1-1.4
Pennsylvania2. HsDgrEqv1.31.60.9
Alabama2. HsDgrEqv1.22.00.4
Arizona2. HsDgrEqv1.22.00.4
Colorado2. HsDgrEqv1.22.10.3
Iowa2. HsDgrEqv1.12.00.3
Texas2. HsDgrEqv1.01.30.7
Washington2. HsDgrEqv0.81.30.3
Idaho2. HsDgrEqv0.82.3-0.7
Nevada2. HsDgrEqv0.82.0-0.4
South Carolina2. HsDgrEqv0.81.40.1
New Mexico2. HsDgrEqv0.71.8-0.3
Oregon2. HsDgrEqv0.71.5-0.1
Florida2. HsDgrEqv0.61.00.3
Delaware2. HsDgrEqv0.62.7-1.5
Missouri2. HsDgrEqv0.61.3-0.1
Louisiana2. HsDgrEqv0.51.4-0.4
Georgia2. HsDgrEqv0.41.0-0.1
New Hampshire2. HsDgrEqv0.41.7-0.9
Utah2. HsDgrEqv0.31.3-0.8
Maryland2. HsDgrEqv0.20.8-0.3
Mississippi2. HsDgrEqv0.21.1-0.7
Nebraska2. HsDgrEqv0.01.3-1.2
Indiana2. HsDgrEqv0.00.6-0.7
Wisconsin2. HsDgrEqv-0.10.5-0.6
West Virginia2. HsDgrEqv-0.21.0-1.3
Ohio2. HsDgrEqv-0.30.1-0.7
Virginia2. HsDgrEqv-0.40.1-1.0
Minnesota2. HsDgrEqv-0.40.1-1.0
Hawaii2. HsDgrEqv-0.61.1-2.2
Massachusetts2. HsDgrEqv-0.6-0.2-1.0
Illinois2. HsDgrEqv-0.9-0.5-1.2
California2. HsDgrEqv-1.0-0.8-1.1
New Jersey2. HsDgrEqv-1.0-0.6-1.4
Kansas2. HsDgrEqv-1.00.1-2.1
Connecticut2. HsDgrEqv-1.0-0.3-1.7
Michigan2. HsDgrEqv-1.4-1.0-1.8
Maine2. HsDgrEqv-1.5-0.4-2.6
Rhode Island2. HsDgrEqv-1.8-0.3-3.3
New York2. HsDgrEqv-2.0-1.8-2.3
Vermont2. HsDgrEqv-2.5-0.2-4.7
District of Columbia2. HsDgrEqv-9.3-6.6-11.9
Alaska2. HsDgrEqv-22.0-18.6-25.4
Nebraska1. LssHsDgr2.13.11.1
Oklahoma1. LssHsDgr1.92.51.2
Kentucky1. LssHsDgr1.41.90.9
South Carolina1. LssHsDgr1.11.60.5
Idaho1. LssHsDgr1.01.80.1
Mississippi1. LssHsDgr1.01.80.1
Montana1. LssHsDgr1.01.70.2
Alabama1. LssHsDgr0.81.50.2
North Dakota1. LssHsDgr0.82.0-0.4
South Dakota1. LssHsDgr0.82.0-0.4
West Virginia1. LssHsDgr0.81.50.0
Texas1. LssHsDgr0.70.90.6
Kansas1. LssHsDgr0.71.40.0
Louisiana1. LssHsDgr0.71.30.1
Vermont1. LssHsDgr0.61.6-0.3
Wisconsin1. LssHsDgr0.60.90.2
Pennsylvania1. LssHsDgr0.50.70.3
Washington1. LssHsDgr0.50.90.2
Utah1. LssHsDgr0.51.1-0.1
Colorado1. LssHsDgr0.40.9-0.1
Minnesota1. LssHsDgr0.40.70.0
New Mexico1. LssHsDgr0.41.2-0.5
Arkansas1. LssHsDgr0.31.0-0.3
Virginia1. LssHsDgr0.30.60.0
Oregon1. LssHsDgr0.30.9-0.2
Arizona1. LssHsDgr0.30.8-0.2
Maine1. LssHsDgr0.10.7-0.5
Maryland1. LssHsDgr0.10.5-0.3
Tennessee1. LssHsDgr0.10.4-0.3
Ohio1. LssHsDgr0.00.2-0.2
Indiana1. LssHsDgr0.00.4-0.4
Michigan1. LssHsDgr0.00.2-0.3
Missouri1. LssHsDgr0.00.3-0.4
Georgia1. LssHsDgr-0.10.3-0.6
Massachusetts1. LssHsDgr-0.20.1-0.4
Iowa1. LssHsDgr-0.20.4-0.8
Connecticut1. LssHsDgr-0.20.2-0.6
Delaware1. LssHsDgr-0.21.0-1.5
North Carolina1. LssHsDgr-0.20.1-0.6
Nevada1. LssHsDgr-0.30.7-1.3
Florida1. LssHsDgr-0.4-0.2-0.6
Illinois1. LssHsDgr-0.5-0.3-0.7
New Jersey1. LssHsDgr-0.5-0.3-0.8
New Hampshire1. LssHsDgr-0.60.2-1.4
Rhode Island1. LssHsDgr-0.70.0-1.4
California1. LssHsDgr-0.8-0.7-0.9
New York1. LssHsDgr-0.8-0.7-1.0
Hawaii1. LssHsDgr-1.1-0.3-1.9
Wyoming1. LssHsDgr-2.1-0.1-4.0
District of Columbia1. LssHsDgr-3.5-1.2-5.9
Alaska1. LssHsDgr-8.6-6.0-11.1


StateEd. Attainmentper 1000 Ed.RsdUpperLower
Delaware6. Grdts20.034.85.329.5
Maine6. Grdts19.631.67.623.9
Oregon6. Grdts18.023.612.411.3
Washington6. Grdts13.517.79.28.5
Montana6. Grdts13.425.51.424.1
Nevada6. Grdts12.221.23.118.1
Vermont6. Grdts10.829.0-7.536.5
Colorado6. Grdts7.812.03.58.5
Texas6. Grdts7.49.94.95.0
Virginia6. Grdts6.210.12.47.7
South Carolina6. Grdts6.212.6-0.212.9
North Carolina6. Grdts5.610.01.38.7
Maryland6. Grdts4.48.30.57.8
Kentucky6. Grdts4.19.6-1.310.9
Alabama6. Grdts4.09.5-1.511.0
New Hampshire6. Grdts3.813.4-5.919.3
Arkansas6. Grdts3.714.7-7.422.2
Florida6. Grdts2.95.9-0.16.0
New Mexico6. Grdts2.712.5-7.119.6
Wyoming6. Grdts2.221.3-16.938.1
District of Columbia6. Grdts1.715.3-11.927.2
Minnesota6. Grdts1.76.6-3.29.8
Utah6. Grdts1.49.3-6.415.7
Georgia6. Grdts1.44.9-2.17.1
Wisconsin6. Grdts1.46.3-3.69.9
California6. Grdts1.02.6-0.63.2
Tennessee6. Grdts0.95.9-4.210.2
Arizona6. Grdts0.86.1-4.510.5
Oklahoma6. Grdts0.78.7-7.316.0
Kansas6. Grdts0.69.4-8.217.6
Connecticut6. Grdts-0.33.4-4.07.3
New Jersey6. Grdts-0.32.1-2.74.9
Idaho6. Grdts-0.712.6-13.926.6
South Dakota6. Grdts-1.918.4-22.140.5
Massachusetts6. Grdts-4.1-1.0-7.26.3
Pennsylvania6. Grdts-4.1-1.3-6.95.5
Missouri6. Grdts-4.21.0-9.310.3
Ohio6. Grdts-4.5-1.1-7.96.9
Iowa6. Grdts-5.02.5-12.515.0
Mississippi6. Grdts-5.51.0-12.013.0
Illinois6. Grdts-5.6-2.5-8.76.2
New York6. Grdts-7.1-5.4-8.93.5
Indiana6. Grdts-7.1-3.2-11.17.9
Louisiana6. Grdts-8.3-1.0-15.714.7
Hawaii6. Grdts-8.82.4-20.122.4
West Virginia6. Grdts-15.1-5.3-25.019.8
Michigan6. Grdts-16.1-12.6-19.67.0
Rhode Island6. Grdts-18.0-6.2-29.723.5
Nebraska6. Grdts-20.2-9.3-31.221.8
North Dakota6. Grdts-25.1-1.9-48.346.4
Alaska6. Grdts-40.1-20.3-59.939.5
Oregon5. BchlrDgr12.617.08.38.7
Colorado5. BchlrDgr10.814.67.07.5
New Mexico5. BchlrDgr10.718.23.314.9
Texas5. BchlrDgr10.111.78.63.1
Arizona5. BchlrDgr10.014.55.49.1
South Carolina5. BchlrDgr9.513.55.67.9
North Carolina5. BchlrDgr7.510.54.56.0
District of Columbia5. BchlrDgr7.424.7-9.934.7
Virginia5. BchlrDgr6.210.02.57.5
Delaware5. BchlrDgr5.215.5-5.020.5
Arkansas5. BchlrDgr5.211.9-1.413.3
Washington5. BchlrDgr4.77.71.66.1
Georgia5. BchlrDgr3.56.20.75.5
Florida5. BchlrDgr2.44.50.44.1
Nevada5. BchlrDgr2.310.9-6.417.3
Maryland5. BchlrDgr1.74.8-1.36.1
Minnesota5. BchlrDgr1.55.2-2.27.4
Tennessee5. BchlrDgr1.35.3-2.67.9
Oklahoma5. BchlrDgr1.06.0-3.99.9
California5. BchlrDgr1.02.2-0.22.4
Louisiana5. BchlrDgr0.95.1-3.38.4
Nebraska5. BchlrDgr0.46.3-5.511.8
Illinois5. BchlrDgr-0.11.9-2.24.0
Hawaii5. BchlrDgr-1.17.8-9.917.7
Connecticut5. BchlrDgr-1.22.3-4.77.0
Kentucky5. BchlrDgr-1.33.8-6.410.2
Missouri5. BchlrDgr-1.52.3-5.47.7
Maine5. BchlrDgr-2.54.3-9.313.6
Rhode Island5. BchlrDgr-2.66.3-11.517.7
New York5. BchlrDgr-3.0-1.2-4.83.6
Pennsylvania5. BchlrDgr-3.2-0.8-5.74.9
Massachusetts5. BchlrDgr-3.4-0.4-6.36.0
Alabama5. BchlrDgr-4.10.1-8.38.4
New Hampshire5. BchlrDgr-4.52.5-11.514.0
New Jersey5. BchlrDgr-4.5-2.2-6.84.6
Idaho5. BchlrDgr-5.15.8-16.021.7
Kansas5. BchlrDgr-5.8-0.2-11.411.3
Iowa5. BchlrDgr-6.3-1.5-11.19.5
Mississippi5. BchlrDgr-7.3-0.8-13.913.1
Indiana5. BchlrDgr-8.8-5.5-12.16.6
West Virginia5. BchlrDgr-9.1-1.2-17.015.8
South Dakota5. BchlrDgr-10.01.4-21.322.7
Utah5. BchlrDgr-10.4-5.6-15.39.7
Ohio5. BchlrDgr-10.9-8.7-13.04.2
Wisconsin5. BchlrDgr-11.7-7.9-15.67.7
Montana5. BchlrDgr-12.1-2.7-21.618.9
North Dakota5. BchlrDgr-12.51.2-26.227.4
Vermont5. BchlrDgr-15.0-0.4-29.529.2
Wyoming5. BchlrDgr-15.7-3.1-28.425.3
Michigan5. BchlrDgr-17.2-14.9-19.64.7
Alaska5. BchlrDgr-66.0-47.4-84.637.2
Montana4. AssctDgr10.824.9-3.328.1
Oregon4. AssctDgr10.215.84.711.0
Arizona4. AssctDgr10.014.45.68.8
South Carolina4. AssctDgr8.913.64.39.3
Oklahoma4. AssctDgr8.113.72.511.1
North Carolina4. AssctDgr8.111.05.25.8
Texas4. AssctDgr7.49.35.43.9
North Dakota4. AssctDgr6.920.7-6.927.6
Utah4. AssctDgr5.710.70.710.0
Missouri4. AssctDgr5.29.80.69.2
Virginia4. AssctDgr4.89.00.68.4
Kentucky4. AssctDgr4.39.7-1.010.7
Georgia4. AssctDgr3.57.00.07.0
Tennessee4. AssctDgr3.48.5-1.610.1
Iowa4. AssctDgr2.46.8-1.98.7
Indiana4. AssctDgr2.45.7-0.86.5
Maine4. AssctDgr2.49.9-5.115.0
New Hampshire4. AssctDgr2.410.4-5.616.0
Alabama4. AssctDgr2.36.5-2.08.5
Colorado4. AssctDgr2.28.0-3.511.5
Delaware4. AssctDgr2.211.6-7.218.7
Washington4. AssctDgr2.05.8-1.97.7
West Virginia4. AssctDgr1.910.2-6.416.6
Nebraska4. AssctDgr1.48.9-6.115.0
Nevada4. AssctDgr1.411.5-8.720.2
Pennsylvania4. AssctDgr1.13.4-1.14.5
Massachusetts4. AssctDgr0.93.8-2.05.8
New Mexico4. AssctDgr0.69.2-8.017.2
Florida4. AssctDgr0.52.6-1.64.1
Connecticut4. AssctDgr-1.04.5-6.510.9
Ohio4. AssctDgr-1.40.8-3.54.3
Wisconsin4. AssctDgr-1.42.0-4.86.8
Mississippi4. AssctDgr-1.64.3-7.611.9
Arkansas4. AssctDgr-1.95.7-9.515.2
New Jersey4. AssctDgr-2.01.1-5.16.2
Hawaii4. AssctDgr-2.49.9-14.724.6
Maryland4. AssctDgr-2.43.2-8.011.3
Louisiana4. AssctDgr-2.83.7-9.212.9
South Dakota4. AssctDgr-3.58.1-15.023.2
Kansas4. AssctDgr-4.32.5-11.213.7
California4. AssctDgr-4.8-3.5-6.02.5
Minnesota4. AssctDgr-5.5-2.3-8.86.6
Illinois4. AssctDgr-5.7-3.3-8.04.8
New York4. AssctDgr-6.8-5.1-8.43.3
Michigan4. AssctDgr-7.1-4.8-9.54.7
Wyoming4. AssctDgr-8.74.4-21.826.1
Idaho4. AssctDgr-10.10.5-20.621.1
District of Columbia4. AssctDgr-10.535.2-56.191.4
Rhode Island4. AssctDgr-12.0-1.1-22.921.7
Vermont4. AssctDgr-22.8-9.0-36.627.6
Alaska4. AssctDgr-50.8-29.2-72.443.2
Idaho3. SomeCllg12.117.76.411.3
South Carolina3. SomeCllg11.415.37.67.7
Colorado3. SomeCllg11.314.78.06.8
Nevada3. SomeCllg8.813.73.99.8
Arizona3. SomeCllg8.110.85.45.3
Montana3. SomeCllg7.915.70.115.6
North Carolina3. SomeCllg7.910.05.74.3
Oregon3. SomeCllg7.611.04.26.9
Oklahoma3. SomeCllg6.610.23.17.1
Arkansas3. SomeCllg6.49.73.16.6
Delaware3. SomeCllg6.213.9-1.515.4
Nebraska3. SomeCllg5.911.70.011.7
Tennessee3. SomeCllg5.88.92.66.3
Alabama3. SomeCllg5.18.12.06.1
Texas3. SomeCllg4.35.53.12.4
Washington3. SomeCllg4.17.21.06.2
New Mexico3. SomeCllg3.89.3-1.610.9
Louisiana3. SomeCllg3.16.20.16.1
Missouri3. SomeCllg3.15.70.45.4
Pennsylvania3. SomeCllg3.14.81.33.4
Virginia3. SomeCllg2.44.70.04.8
Utah3. SomeCllg2.26.2-1.88.0
Kansas3. SomeCllg2.16.4-2.38.7
South Dakota3. SomeCllg1.79.5-6.115.5
Kentucky3. SomeCllg1.35.3-2.78.1
Georgia3. SomeCllg0.93.2-1.54.8
Wisconsin3. SomeCllg0.83.4-1.75.1
Vermont3. SomeCllg0.711.2-9.921.1
Massachusetts3. SomeCllg0.32.9-2.25.1
Iowa3. SomeCllg0.14.1-3.98.0
North Dakota3. SomeCllg-0.49.6-10.420.0
Florida3. SomeCllg-1.00.8-2.73.5
Indiana3. SomeCllg-1.01.5-3.65.1
Ohio3. SomeCllg-2.1-0.8-3.42.7
Maryland3. SomeCllg-2.9-0.1-5.65.6
West Virginia3. SomeCllg-2.93.4-9.312.7
Minnesota3. SomeCllg-3.1-0.4-5.85.4
Mississippi3. SomeCllg-3.20.5-6.97.4
Illinois3. SomeCllg-4.1-2.2-5.93.7
Maine3. SomeCllg-4.81.0-10.611.6
California3. SomeCllg-5.4-4.5-6.21.7
New Hampshire3. SomeCllg-5.41.4-12.313.7
New Jersey3. SomeCllg-6.8-4.6-9.04.5
Michigan3. SomeCllg-6.9-5.5-8.32.7
Wyoming3. SomeCllg-7.66.5-21.728.3
New York3. SomeCllg-8.3-7.0-9.62.6
Connecticut3. SomeCllg-9.7-6.7-12.86.1
Hawaii3. SomeCllg-10.1-1.5-18.617.1
Rhode Island3. SomeCllg-11.0-4.8-17.212.4
District of Columbia3. SomeCllg-19.1-4.3-34.029.7
Alaska3. SomeCllg-53.0-38.6-67.428.8
South Dakota2. HsDgrEqv13.020.15.914.2
North Dakota2. HsDgrEqv8.116.3-0.216.6
Oklahoma2. HsDgrEqv7.811.04.56.5
Kentucky2. HsDgrEqv6.68.94.34.6
Montana2. HsDgrEqv6.011.70.411.3
Colorado2. HsDgrEqv5.59.51.67.9
Tennessee2. HsDgrEqv5.17.13.14.1
Arizona2. HsDgrEqv5.08.31.86.5
North Carolina2. HsDgrEqv5.07.03.13.9
Arkansas2. HsDgrEqv4.67.91.36.5
Wyoming2. HsDgrEqv4.513.7-4.718.5
Alabama2. HsDgrEqv4.06.61.45.2
Texas2. HsDgrEqv4.05.12.92.1
Iowa2. HsDgrEqv3.76.60.95.6
Pennsylvania2. HsDgrEqv3.64.62.62.0
Washington2. HsDgrEqv3.55.81.34.5
Idaho2. HsDgrEqv3.08.7-2.711.4
Oregon2. HsDgrEqv3.06.2-0.36.6
Nevada2. HsDgrEqv2.77.0-1.58.5
New Mexico2. HsDgrEqv2.76.7-1.27.9
South Carolina2. HsDgrEqv2.54.70.34.4
Florida2. HsDgrEqv2.23.40.92.6
Delaware2. HsDgrEqv1.98.8-5.013.8
Missouri2. HsDgrEqv1.94.2-0.44.6
Georgia2. HsDgrEqv1.63.3-0.23.5
New Hampshire2. HsDgrEqv1.46.0-3.19.1
Louisiana2. HsDgrEqv1.44.0-1.35.3
Utah2. HsDgrEqv1.15.5-3.28.7
Maryland2. HsDgrEqv1.03.3-1.34.6
Mississippi2. HsDgrEqv0.63.6-2.56.1
Nebraska2. HsDgrEqv0.15.0-4.79.7
Indiana2. HsDgrEqv-0.11.7-1.93.7
Wisconsin2. HsDgrEqv-0.31.4-2.03.4
West Virginia2. HsDgrEqv-0.42.5-3.35.8
Ohio2. HsDgrEqv-0.90.2-2.02.1
Virginia2. HsDgrEqv-1.80.3-3.94.2
Minnesota2. HsDgrEqv-1.80.4-4.04.4
Hawaii2. HsDgrEqv-2.13.9-8.011.9
Massachusetts2. HsDgrEqv-2.6-0.8-4.43.6
Illinois2. HsDgrEqv-3.4-2.0-4.92.9
New Jersey2. HsDgrEqv-3.5-2.1-4.92.9
Connecticut2. HsDgrEqv-3.9-1.3-6.55.2
Kansas2. HsDgrEqv-3.90.4-8.38.7
Maine2. HsDgrEqv-4.5-1.2-7.86.6
California2. HsDgrEqv-4.6-3.7-5.51.7
Michigan2. HsDgrEqv-4.7-3.3-6.12.8
Rhode Island2. HsDgrEqv-6.8-1.0-12.611.6
New York2. HsDgrEqv-7.9-6.9-8.92.0
Vermont2. HsDgrEqv-8.0-0.8-15.314.5
District of Columbia2. HsDgrEqv-50.6-36.1-65.029.0
Alaska2. HsDgrEqv-77.7-65.6-89.824.2
Nebraska1. LssHsDgr25.237.512.924.6
North Dakota1. LssHsDgr16.239.3-6.846.1
Oklahoma1. LssHsDgr15.120.210.010.2
Montana1. LssHsDgr14.626.22.923.2
South Dakota1. LssHsDgr10.426.6-5.832.3
Vermont1. LssHsDgr10.125.6-5.431.0
Kentucky1. LssHsDgr10.013.46.66.8
Idaho1. LssHsDgr9.517.81.316.6
Kansas1. LssHsDgr7.815.50.115.4
South Carolina1. LssHsDgr7.711.43.97.5
Wisconsin1. LssHsDgr7.311.53.18.4
Pennsylvania1. LssHsDgr6.08.43.64.7
West Virginia1. LssHsDgr5.911.50.411.1
Mississippi1. LssHsDgr5.911.00.710.3
Washington1. LssHsDgr5.69.21.97.3
Alabama1. LssHsDgr5.59.61.58.0
Utah1. LssHsDgr5.512.6-1.614.1
Minnesota1. LssHsDgr5.410.40.410.1
Louisiana1. LssHsDgr4.48.10.77.4
Texas1. LssHsDgr4.25.13.31.8
Colorado1. LssHsDgr4.19.0-0.89.8
Virginia1. LssHsDgr3.05.90.25.7
Oregon1. LssHsDgr3.08.3-2.210.5
Arkansas1. LssHsDgr2.36.9-2.29.1
New Mexico1. LssHsDgr2.38.0-3.411.4
Arizona1. LssHsDgr2.05.6-1.67.2
Maine1. LssHsDgr1.49.8-7.116.8
Maryland1. LssHsDgr0.84.7-3.28.0
Tennessee1. LssHsDgr0.43.3-2.55.8
Ohio1. LssHsDgr0.32.5-2.04.5
Indiana1. LssHsDgr0.13.3-3.26.4
Missouri1. LssHsDgr-0.43.1-3.96.9
Michigan1. LssHsDgr-0.42.3-3.15.4
Georgia1. LssHsDgr-1.02.3-4.36.6
Massachusetts1. LssHsDgr-1.81.1-4.65.7
North Carolina1. LssHsDgr-1.80.7-4.35.0
Nevada1. LssHsDgr-1.94.4-8.112.6
Delaware1. LssHsDgr-2.09.6-13.723.3
Connecticut1. LssHsDgr-2.32.2-6.89.0
Iowa1. LssHsDgr-2.55.4-10.515.9
Florida1. LssHsDgr-3.4-1.8-5.03.2
Illinois1. LssHsDgr-4.3-2.2-6.34.0
California1. LssHsDgr-4.4-3.7-5.01.3
New Jersey1. LssHsDgr-5.3-2.7-7.95.2
Rhode Island1. LssHsDgr-5.50.2-11.211.4
New York1. LssHsDgr-6.3-5.1-7.42.3
New Hampshire1. LssHsDgr-9.02.7-20.723.4
Hawaii1. LssHsDgr-16.7-4.7-28.724.0
District of Columbia1. LssHsDgr-33.4-11.3-55.544.2
Wyoming1. LssHsDgr-33.5-1.9-65.263.3
Alaska1. LssHsDgr-121.3-85.2-157.472.2

Related articles:
Nebraska Brain Drain Migration and Ed. Attainment, 2015 United States ACS

END