Data used in the project is derived from the DataMaster IPEDS project. Details of the project can be found at: Youtube.com and Tableau Public
As outlined in my previous article: College ScoreCard Earning by Major - 4-Year Public Bachelor, the newest College ScoreCard data has published the median salary for college graduates by majors, first year after graduate from college. In my previous article, I have concentrated on the public 4-year colleges. For this article, I have included the private not-for-profit 4-year colleges. This includes the elite private colleges like Harvard, MIT, ... etc.
As with previous article, in addition to the interactive tools provided, the author has prepared few static charts at the end of the article that facilitate the comparison between various majors/fields-of-study.
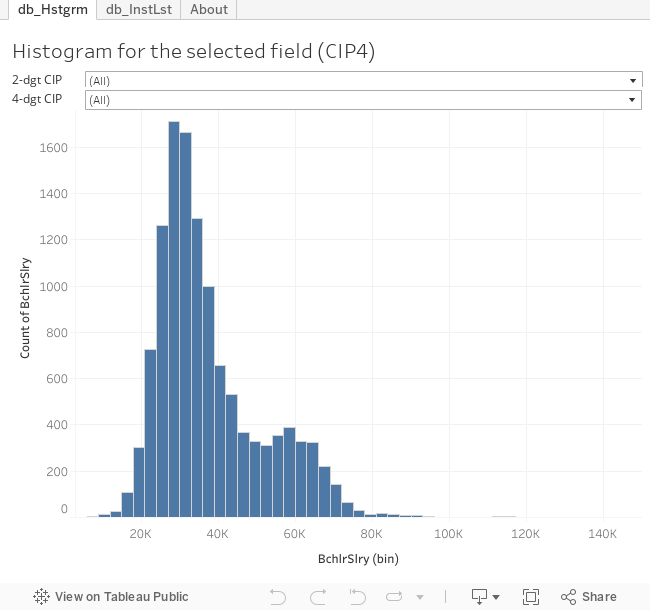
Below is the histogram chart for salary. The chart can be used to see the overall picture of the data provided by the college scorecard data. By setting both dropdowns to (All), the chart shows overall salary range for programs listed in the college scorecard dataset. Most program prepared graduates to earn a median wage of about $27,000 a year. In comparison, there are few programs that their graduates were paid above $90,000 a year. The was one program that was paid $141,000 a year and which is the highest. There were also few programs that the graduates earned only $3,000 a year.
By selecting a 2-digits CIP code, say 52 - Business, you can see that, for business major, the highest paid earned is about $105,000 while most of the program earned their graduates at $39,000 a year. Divining in by selecting a 4-digits CIP code, say 52.03, you can see that most accounting program earned their graduates at $42,000 a year while one program earned its graduate $81,000 a year.
Figure 1, Histogram Chart for Salary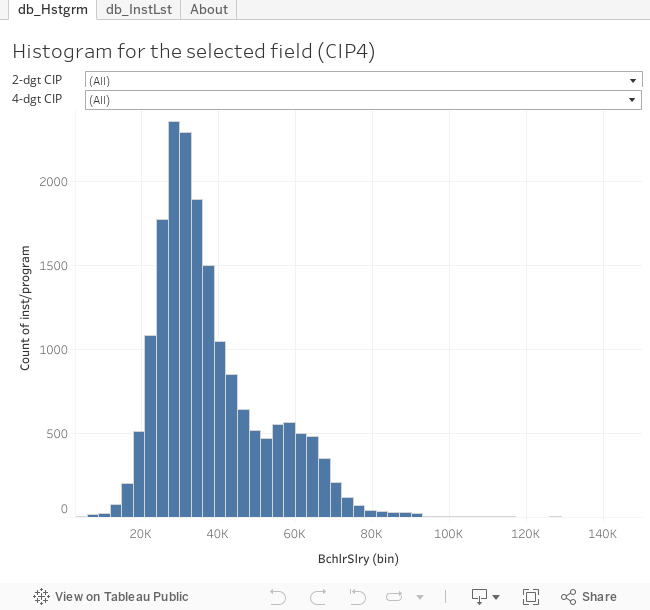
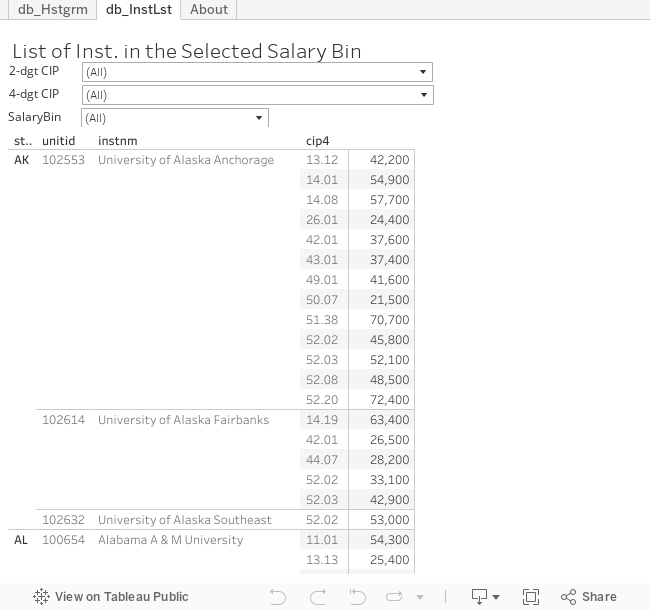
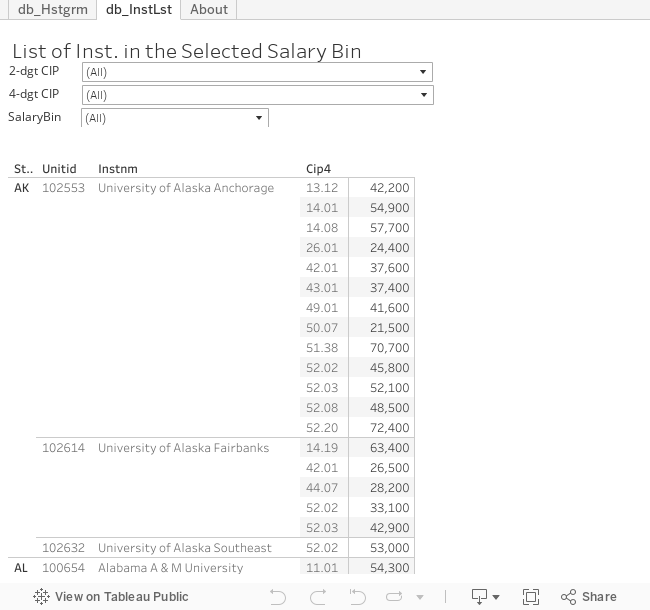
If you were looking at the Figure 1 and were wondering who were those schools that provided high salary earning, you can use the Figure 2 below to find out.
For example, if you like to know which program/Inst. prepared its students for the most earning, keep the first two dropdown at (All), and select the highest earning category in the third dropdown, which will be $153,000. The program shows up is the computer program CIP 11.01 at California Institution of Technology. For particular field, you can select a 2-digits CIP first, and while leaving the 4-digits CIP code at (All), you can use the salary bin dropdown to select the salary. Once you did that, you will see a list of schools that fall inside that salary range along with the 4-digits CIP and the salary. Of cause, if you have decided on the 4-digits CIP major, you can go straight to the 4-digits CIP.
Have fun and enjoy!Figure 2, the List of Institutions
Hope you are having fun so far.
There are many use of the above tools. If you are a high school graduates or parents and are looking for a suitable school, you can use the tool get some insights of you school. If you already have schools in your mind, these tools can give you a sense of where those school stand in terms of earning. But! Earning isn't everything. Otherwise, everyone would just aimed for the highest paid school/program. Remember that, everyone is different. It is really a matter of did you do your best? Schools too! These tools are telling schools to do their best and let students to vote with their feet.
The following charts are trying to provide some comparison information between fields/majors. It is not to sway your decision but to provide big pictures as in the openness and transparency of the need of a democratic system. Open and transparency does not mean free but a concept that people deserve the equal rights to access the information. For more on that topic, look at DemoMatters.org
Let's begin with the chart for STEM fields. STEM was put forward in the wake of worrying US falling behind in the world (economic) competition. Personally, however, I would like to view it as a movement to drive people to do their best! Many people are capable of knowing/learning more of STEM. The STEM is not going to push out other trainings/majors. But on the other hand, if people are avoiding STEM to avoid generous learning and studying, maybe this is a thing that can make a difference.
As shown in the chart, not all STEM fields are the same and, yes, they are not! These days, a lot of things are considered STEM and it really lost the focus from many point of views. From the salary's point of view, we should understand that it simply reflect the labor market's supplies and demands. Because not many students are finishing the engineering degrees (for one reason or the others), there are shortages for engineers. Also, because there isn't 'critical' needs for physicists and, therefore, their salary weren't high. Physicists may know a lot about how things works and could be a better technician or engineer. But, people can care less if you know the thing. If all it take is to follow procedure to fix things, so be it. So, don't feel bad. It is just the market value, it does not measure what you are. On the other hand, if you can but you don't, then that is a different matter.
From Figure 3, we can easily see that, in general, engineers got paid well followed by one branch of the health field along with 'information service' and 'engineering technician'. One interesting observed is that the health fields actually broken into two humps - the higher humps are pretty much correspond to the registered nurses and the other hump are much of administrative, nutrition and other services. Looking at other components in the STEM designation, they aren't doing as well. Other components leaded by the mathematician, then the 'physicist chemists' and followed by the social scientist, the second branch of the health field and, then, the biologist.
Figure 3, summary for STEM fields
Liberal Arts and Humanities graduates are constantly been considered the opposites to the STEM graduates. However, as to the first year salary, most liberal arts were paid compatibly to physicist and chemist.
Figure 4, Humanities and Liberal Arts
Besides the STEM and Liberal Arts fields, there are few fields that are well established and worth to take a look at. These are the business, the education, the visual/performance arts, and the agricultural related fields. Comparing to STEM fields, the business graduates got paid relatively well comparable to that of mathematician. The education graduates got paid comparable to that of physicist, followed slightly by the agricultural graduates. Compare to all fields we have discussed, the visual/performance artist probably paid the least, where the peak located.
Figure 5, Some major fields
Figure 6 shows some other fields that have relatively more data (i.e. more inst. provided the training). Within those, Architects doing relatively well.
Figure 6 and 7, fields with relatively more data

The rest of fields are shown in Figure 8 and 9. The number of data points presented in the ScoreCard are low - may just because few students are in those fields and the US Education department can have enough data to insure the data is statistically sound.
Figure 8 and 9, fields with relatively less data